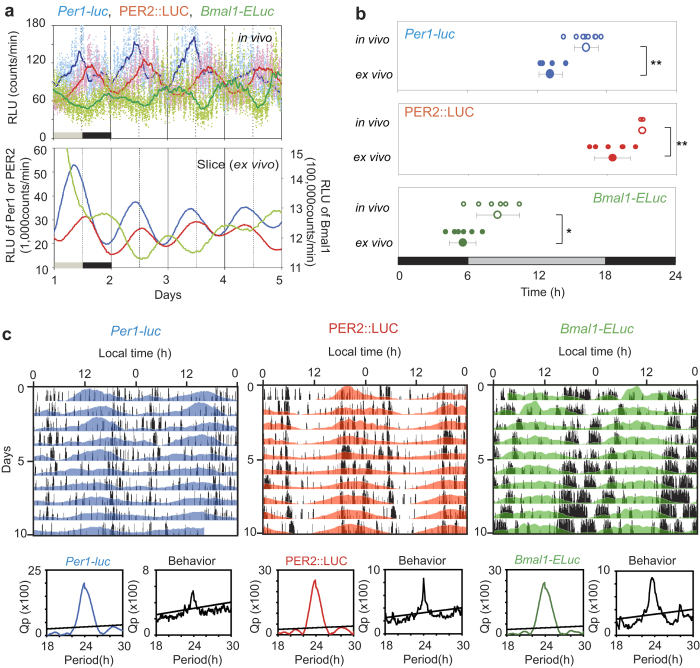
Figure 1. Circadian rhythms in clock gene bioluminescence from the SCN and in behavior in freely moving mice.
(a) Typical examples of Per1-luc (blue), PER2::LUC (red), and Bmal1-ELuc (green) rhythms in the SCN in vivo (upper) and ex vivo (lower). In vivo bioluminescence is plotted as raw counts at one min intervals (dots) and as a 4 h moving average (solid lines). Ex vivo bioluminescence is plotted at 10 min intervals as a 50 min moving average. Vertical lines in each panel indicate local times (solid line, 06:00 h; broken line, 18:00 h). (b) Circadian peak phases of Per1-luc (blue), PER2::LUC (red), and Bmal1-ELuc (green) in vivo (open circle) and ex vivo (closed circle) in the first circadian cycle (Day 1 in constant darkness (DD)) for the in vivo experiment and on Day 1 of culturing for the ex vivo experiment. Smaller circles indicate individual peaks and larger circles with a bar indicate the group means and SD. Grey and black bars at the bottom of each panel indicate the antecedent light-dark (LD) cycle (black: dark phase) before transfer to DD. Student’s t-test: *, <0.05; **, <0.01. (c) Representative examples of in vivo circadian Per1-luc (blue), PER2::LUC (red) or Bmal1-ELuc (green) rhythms in the SCN are illustrated with behavior (black) in actograms. Chi square periodograms for clock gene reporter and behavior activity are demonstrated under each actogram with the same colors as in the actogram. An oblique line in the periodogram indicates a significance level of p = 0.05. Each line shows the gene expression and activity distribution across a day, and sequential days are plotted from top to bottom. For better visualization, actograms are double plotted (48-h x axis). In vivo circadian rhythms are smoothed by a 4 h moving average method and detrended by a 24 h moving average subtraction method.

