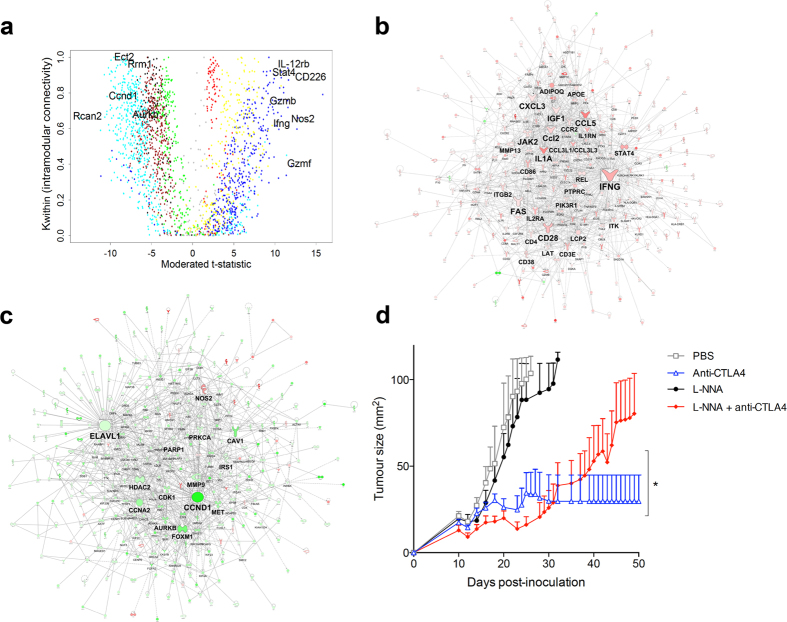
Figure 3. Computational identification of hubs associated with the response to checkpoint blockade.
(a) Weighted gene correlation network analysis: the x axis depicts the differential expression of the genes, the y-axis the Kwithin value, a measure of connectivity; the genes are colour-coded per module similar to Fig 2c (blue codes for genes within the immune module; cyan for genes within the cancer module) (b) Prior knowledge-based graphical reconstruction of the wiring diagram of the immune module and (c) the cancer module. (d) Tumor growth curve of AB1-HA tumour-bearing mice treated with anti-CTLA4 in combination with competitive NOS2 inhibitor L-NNA, showing abrogation of anti-CTLA4 efficacy.

