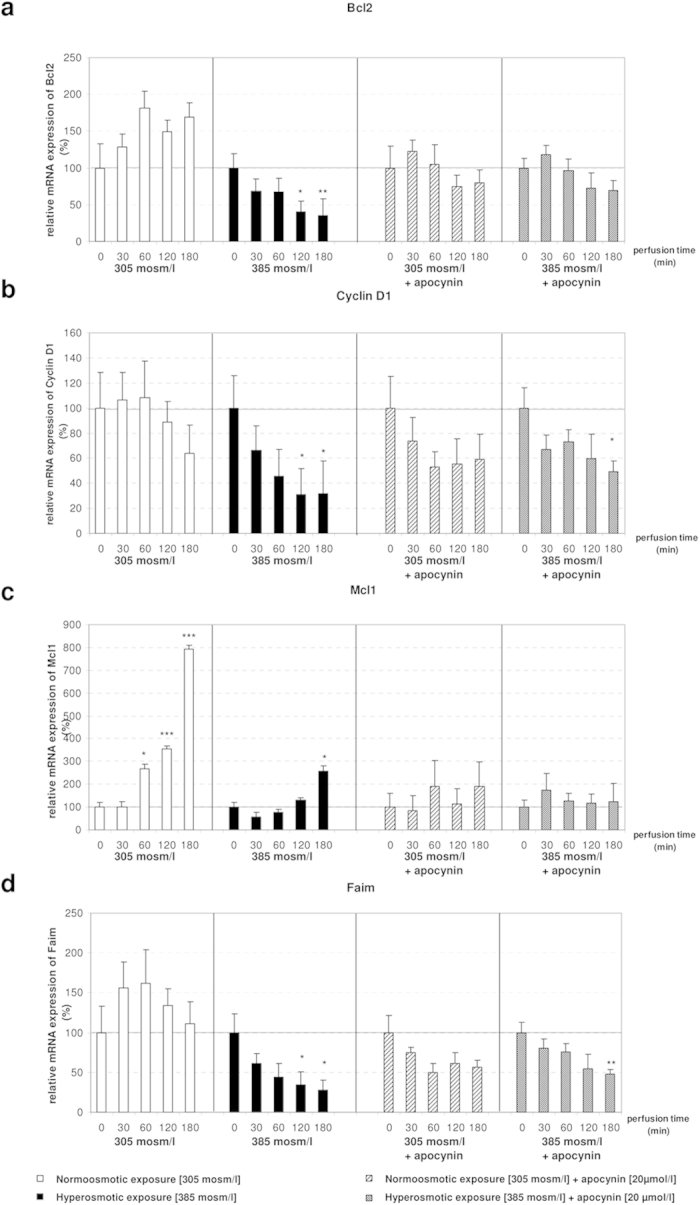
Figure 4. Bcl2 is not significantly changed at the mRNA level in hyperosmotically perfused rat livers after addition of apocynin.

(a) Bcl2 is not significantly changed by hyperosmolarity after addition of apocynin. (b) Downregulation of Ccnd1 under hyperosmotic exposure is attenuated by administration of apocynin. (c) Mcl1 is not significantly changed in both normoosmotic and hyperosmotic conditions, when apocynin is added. (d) Faim is significantly downregulated after 180 minutes of hyperosmotic stimulation and apocynin, while it is not significantly changed after 120 minutes in the same experiment. qPCR runs were normalized according to the ΔΔCt method using β-Tubulin as reference gene. Statistical analysis was carried out by unpaired student’s t-test. Data are shown as average ± S.E.M. of 3 independent experiments. The values of unstimulated controls (T0) were set arbitrarily to 100.
