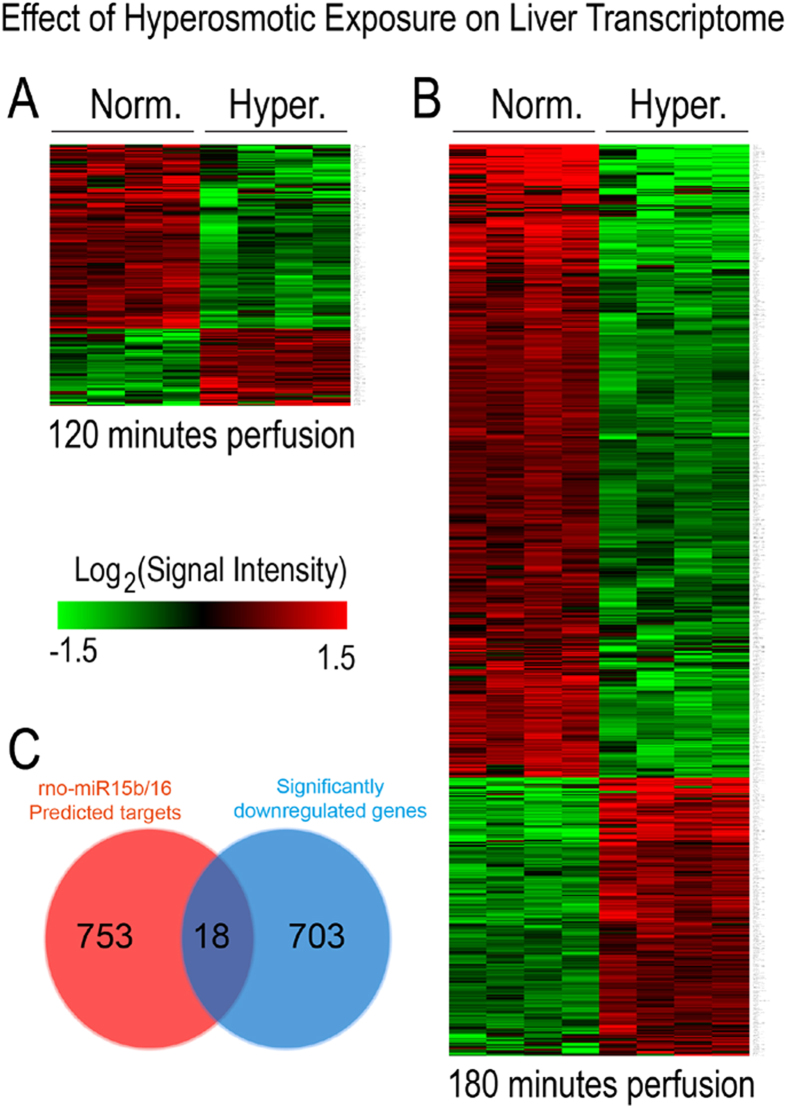
Figure 9. Heat map of genes with altered expression levels under hyperosmolarity.
Hierarchical clustering representing the differential expression of significantly regulated genes in rat livers perfused with normoosmotic (305 mosm/l) and hyperosmotic (385 mosm/l) medium for 120 and 180 minutes. Hierarchical tree of gene clusters was generated by applying the Cousine Matrix. (A) 88 transcripts are upregulated, while 211 transcripts are downregulated under hyperosmotic exposure at 120 minutes. (B) 319 transcripts are upregulated, while 724 transcripts are downregulated under hyperosmotic exposure at 180 minutes. (C) Venn diagram presenting the number of genes and the overlap of miR-15a/b and miR-16 predicted target genes and the downregulated genes on the Affymetrix Chip. Target prediction analysis of the miR-15a/b and miR-16 was carried out by using the miRWalk algorithm.

