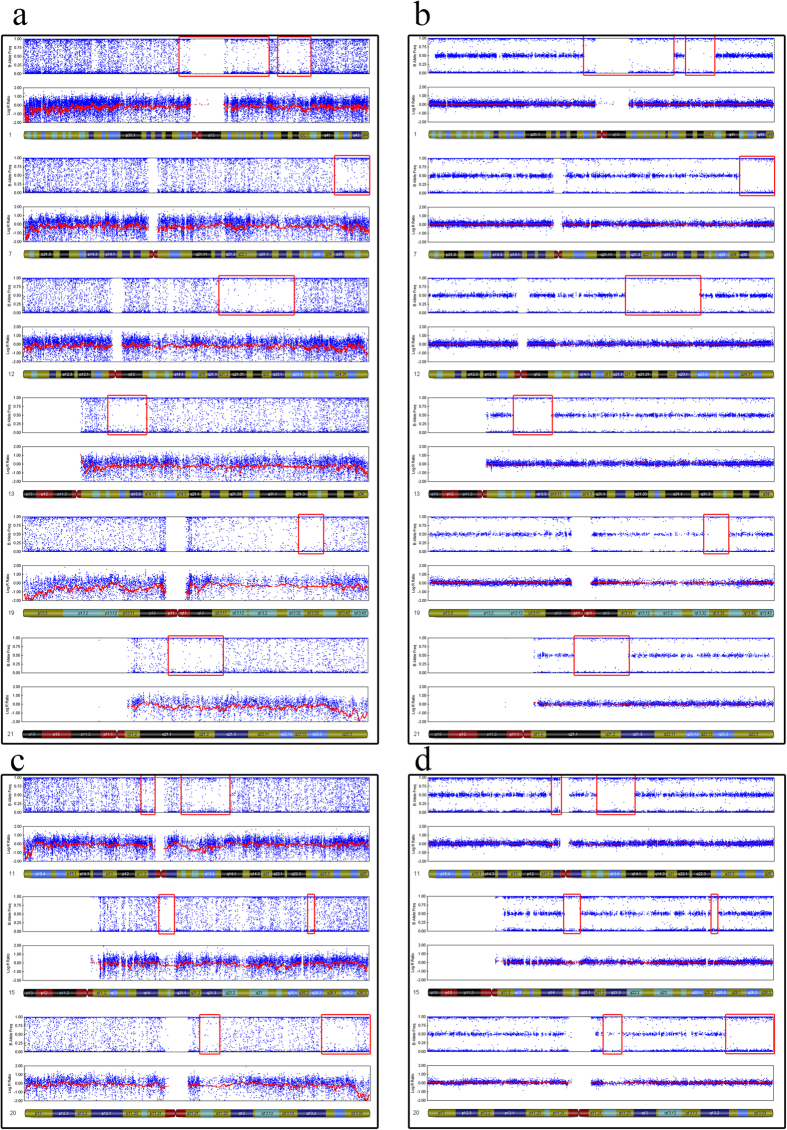
Figure 1. Comparison of SNP results obtained following the amplification of whole blood DNA and limited cell samples.
Multi-cell and limited-cell results indicate the same UPD pattern on these chromosomes. a. UPDs detection on chromosome 1, 7, 12, 13, 19 and 21 using MDA-amplification production of limited cell. b. UPDs detection on chromosome 1, 7, 12, 13, 19 and 21 using global genomic DNA. c. UPDs detection of single cell on chromosome 11, 15 and 20. d. UPDs detection of multi cells on chromosome 11, 15 and 20.

