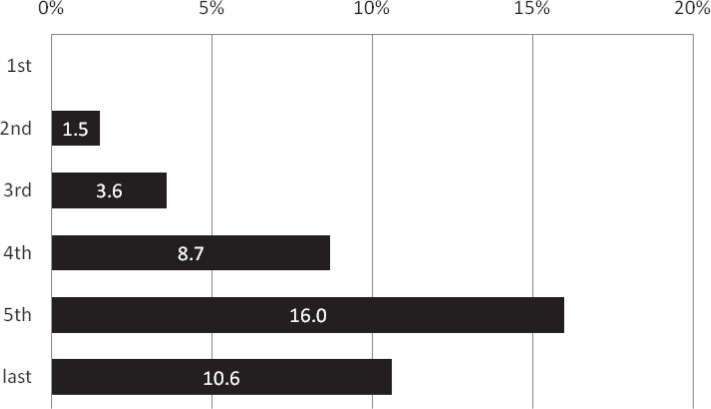
Fig. 5.
Annual transition of the proportion of the patients receiving IV t-PA (%). The proportion of patients receiving IV t-PA showed an annual increase from 1.5% in the second period just after the approval of IV t-PA to 16.0% in the fifth period (p = 0.015 comparing the third and fourth periods; p = 0.015 comparing the fourth and fifth periods). IV t-PA: intravenous thrombolysis using tissue plasminogen activator.

