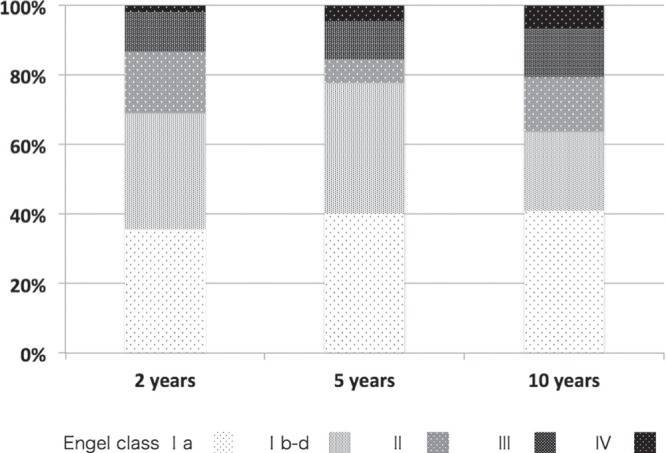
Fig. 2.

Bar graph demonstrated proportion of each surgical outcome of the patients in who have been followed in detail throughout the study period of 10 years. The proportion of Engel Class Ia, III, and IV increased a bit from 36% to 41%, from 11% to 14%, from 2% to 7%, respectively. As for Engel Class Ib-d, II, there was no constant tendency in proportional change.
