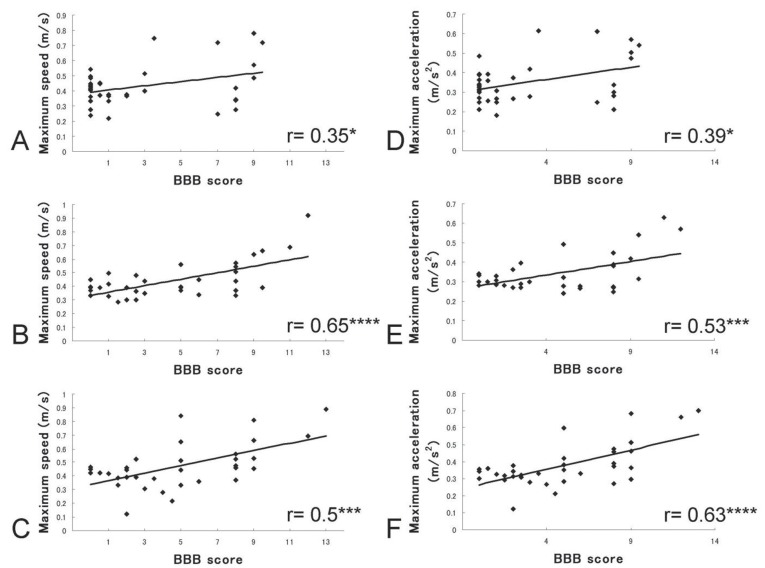
Fig. 2.
Correlation between Basso-Beattie-Bresnahan (BBB) scores and maximum speed and acceleration. A–C: Scatter diagrams of BBB scores and maximum speed at 2, 4, and 6 weeks after spinal cord injury (SCI). The distribution of BBB scores shifted as time advanced, but a significant correlation was preserved. D–F: Scatter diagrams of BBB scores and maximum acceleration at 2, 4, and 6 weeks after SCI, respectively. A significant correlation was again apparent. *p < 0.05, ***p < 0.001, ****p < 0.0001.

