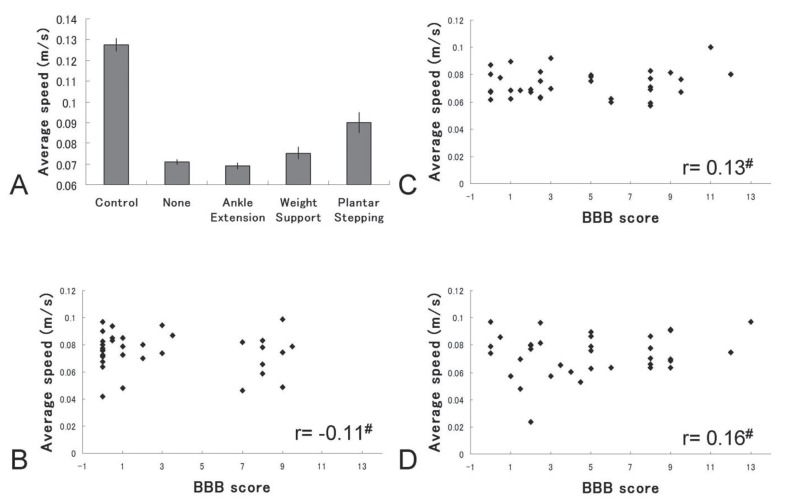
Fig. 5.
Average speed. A: Average speed demonstrated a stepwise increase with improved factors. B–D: Representative scatter diagram of Basso-Beattie-Bresnahan (BBB) scores and average speed, calculated from the total distance moved and total time spent moving at 2, 4, and 6 weeks after spinal cord injury (SCI). No significant correlation was apparent. #p > 0.05.

