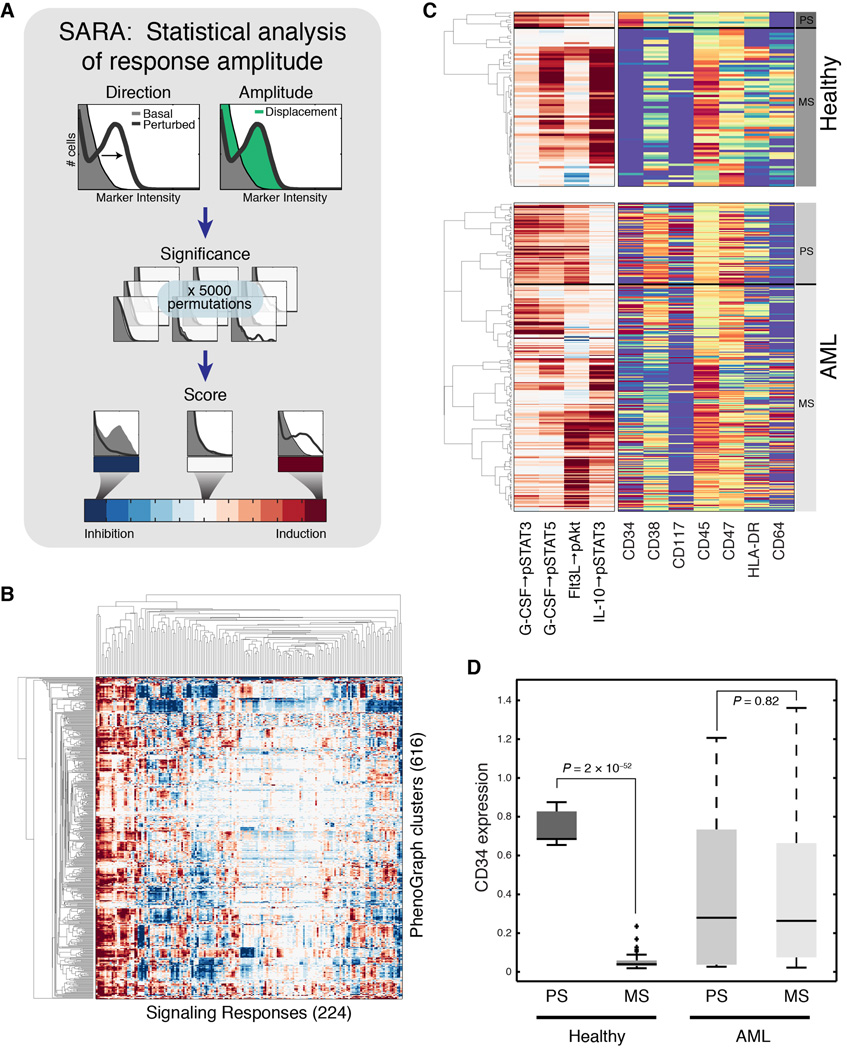
Fig. 4. Analysis of perturbation response generates signaling phenotypes.
(A) A cartoon depicting how SARA uses the single-cell distributions together with permutation testing to score signaling response. (B) SARA, applied to every signaling molecule for every perturbation in every subpopulation, produced ~138,000 responses, which were compiled into 224-dimensional signaling phenotypes for each subpopulation (columns) for each of 616 subpopulations (rows). Rows and columns ordered by agglomerative linkage. (C) Hierarchical clustering of 4 developmentally-relevant signaling responses in the healthy samples (top panel) identified patterns of primitive signaling (PS) and mature signaling (MS) correlated with expression of CD34 and CD45, in the healthy samples. Hierarchical clustering of the same signaling responses in the AML samples (bottom panel) identified a cluster of subpopulations that recapitulated the primitive signaling pattern, but lacked a consistent surface phenotype. Color scales are as in Figures 3A and 4A. (D) Box plots comparing CD34 expression between signaling clusters identified in (C). CD34 expression was significantly associated with primitive signaling only in the healthy samples.

