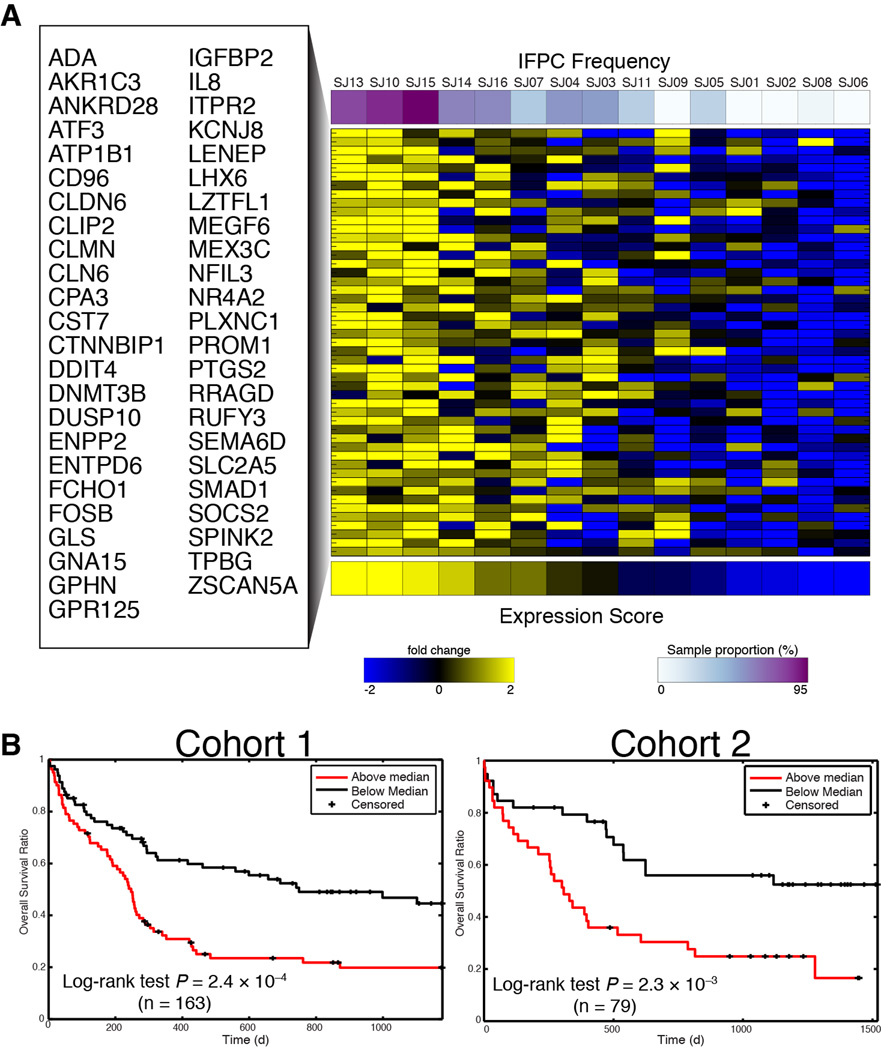
Fig. 7. Frequency of IFPCs identifies a gene expression signature that predicts clinical outcome.
(A) IFPC gene signature identified by deconvolution of bulk expression data using IFPC frequency. The heat map displays expression of each gene in the bulk measurements. Rows are alphabetically ordered; columns are ordered by the mean expression of the genes in the signature. (B) The mean of the IFPC signature forms a clinically significant prognostic indicator of overall survival in 2 independent cohorts of adult AML (Metzeler et al., 2008). Patients were assigned to groups for Kaplan-Meier analysis based on whether their IFPC expression score was below or above the cohort median. P values obtained from log-rank test.

