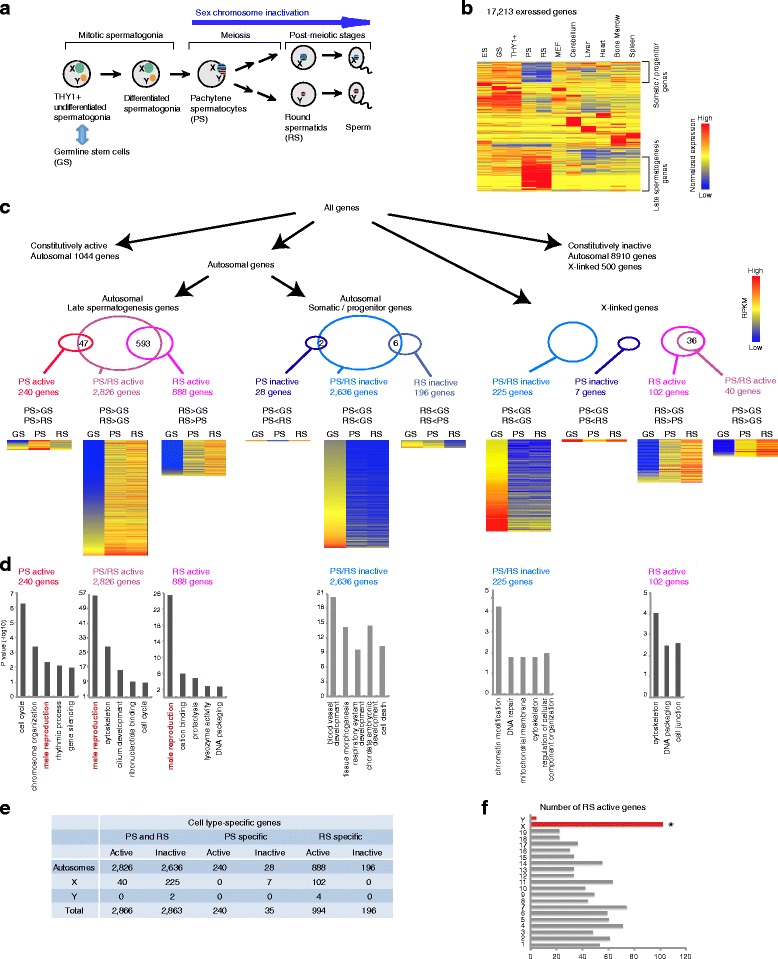
Fig. 1.

The global transcriptome changes during the late stages of male germline. a Schematic of spermatogenesis. In this study, germline stem (GS) cells were used as the representative stage of the stem cell phase. X chromosomes are depicted in green and the Y chromosomes are depicted in orange. Barred chromosomes represent suppressed transcription. b A heatmap showing gene expression patterns among several germ cells versus somatic cells. All 17,213 genes that showed more than 3 RPKM in at least one cell type are shown. RNA-seq data were obtained from published studies as described in the Methods section. c Flow chart of grouping of each class of spermatogenesis genes, degree of overlaps, and their expression heatmaps. d Gene ontology analysis of each class of spermatogenesis genes. e Summary table of each class of spermatogenesis genes. f Enrichment of RS active genes on the X chromosome. *P <2.2e-16, chi-square test. ES, embryonic stem cells; GS, germline stem cells; MEF, mouse embryonic fibroblasts; PS, pachytene spermatocytes; RPKM, reads per kilobase per million; RS, round spermatids; THY1+, THY1+ undifferentiated spermatogonia
