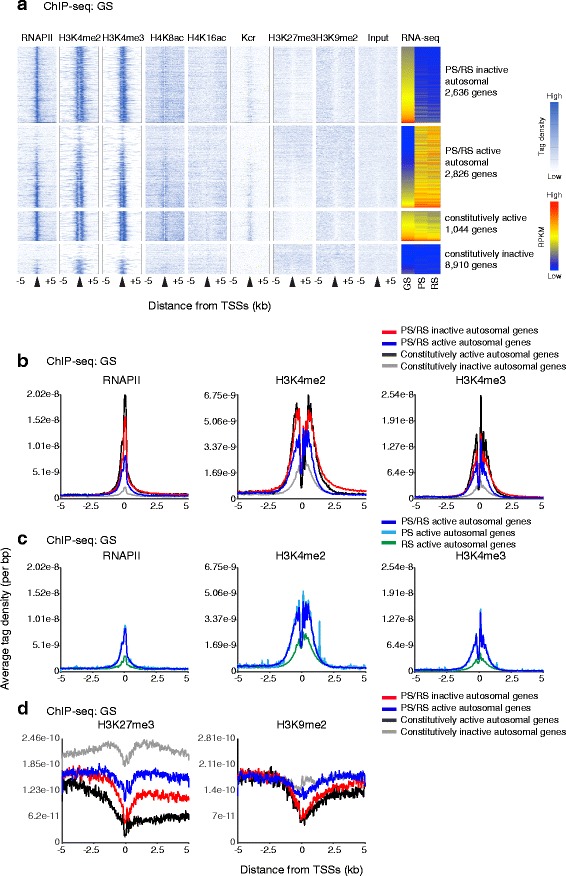
Fig. 3.

Autosomal late spermatogenesis genes are poised in GS cells for activation at PS. a A heatmap showing distribution of histone marks in GS cells. Tag density around TSS (±5 kb) is shown. b ATD of active marks in representative groups in GS cells. c ATD of active marks at the genes activated in later stages. d ATD of silent marks in representative groups in GS cells. ATD, average tag density; GS, germline stem cells; PS, pachytene spermatocytes; TSS, transcription start site
