
Fig. 3.
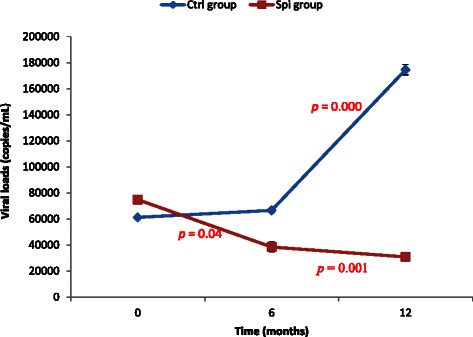
Variation of viral load of the groups during the experiment. Values are expressed as mean values ± SD, Ctrl: Control, Spi: Spirulina group; n = 78 after 6 months and n = 68 after 12 months; p < 0.01
Official websites use .gov
A
.gov website belongs to an official
government organization in the United States.
Secure .gov websites use HTTPS
A lock (
) or https:// means you've safely
connected to the .gov website. Share sensitive
information only on official, secure websites.
Variation of viral load of the groups during the experiment. Values are expressed as mean values ± SD, Ctrl: Control, Spi: Spirulina group; n = 78 after 6 months and n = 68 after 12 months; p < 0.01