
Fig. 2.
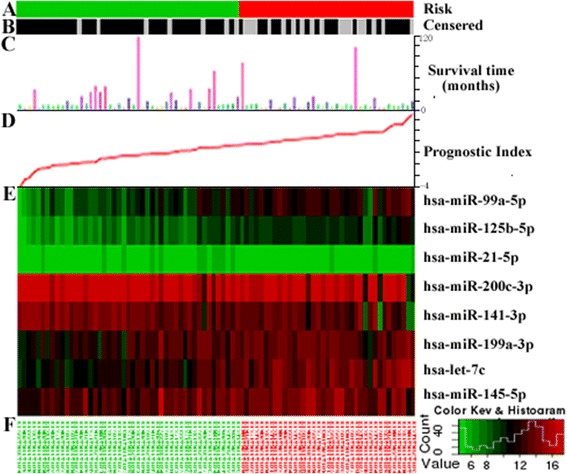
miRNA predictor-score analysis of 84 patients in TCGA cohort. Information related to censoring event being analyzed (risk group assignment (a), censoring status (b), time related to event (c), and prognostic index (d). Color-gram of miRNA expression profiles of TCGA patients. miRNA expression profiles shown as a heatmap helping in the analysis and visual correlation of the survival analysis and gene expression. Samples are shown in x-axis while genes are shown in y-axis (e). The genes are clustered by Euclidean distance. The patients’ ID showed under the figure (f)