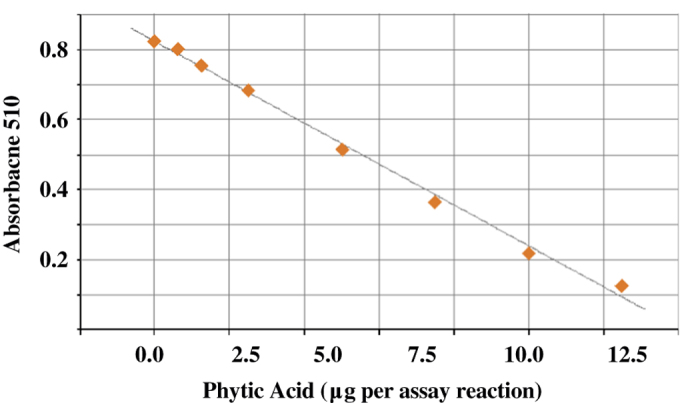
Figure 1. A typical standard curve used to assay phytic acid using the HL method.

The known concentrations of phytic acid standards are plotted against their absorbance at 510 nm after sample processing. Please see text for details.

The known concentrations of phytic acid standards are plotted against their absorbance at 510 nm after sample processing. Please see text for details.