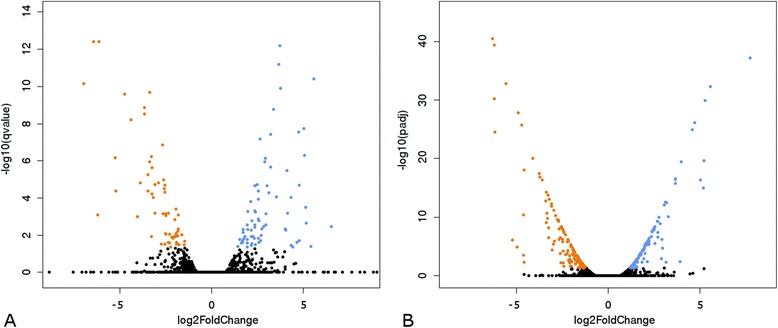
Fig. 8.

Gene expression changes after immune challenge. Volcano plots show the statistical significance of the difference in expression observed (p-value from a t-test, q-value in case of Cuffdiff and adjusted p-value in case of DEseq; log10 scale). The x-axis indicates the differential expression profiles, plotting the fold-induction ratios in a log-2 scale during immune challenge. The list of significantly differentially expressed protein coding genes can be found in Table S9 (Additional file 12). a Volcano plot from Cuffdiff data. Up-regulated genes (q-value < 0.05 and log2FoldChange ≥1) are shown as blue dots and the down-regulated genes (q-value < 0.05 and log2FoldChange ≤ −1) are shown as orange dots. The top three protein coding genes most up-regulated are Cflo_N_g6748 (hypothetical), Cflo_N_g2827 (voltage-dependent calcium channel type A subunit alpha-1) and Cflo_N_g12631 (serine proteinase Stubble). The three most down-regulated genes include Cflo_N_g2215 (putative chitin binding peritrophin-a domain containing), Cflo_N_g1319 (serine protease inhibitor 3) and Cflo_N_g4308 (lipase member H). b Volcano plot from DEseq data. Up-regulated genes (adjusted p-value < 0.05 and log2FoldChange ≥1) are shown by blue dots and the down-regulated genes (adjusted p-value < 0.05 and log2FoldChange ≤ −1) are shown by orange dots. The top three protein coding genes most up-regulated are Cflo_N_g6748 (hypothetical), Cflo_N_g5222 (hypothetical) and Cflo_N_g531 (aminopeptidase N). The three top down-regulated genes include Cflo_N_g2215 (putative chitin binding peritrophin-a domain containing), Cflo_N_g1319 (serine protease inhibitor 3) and Cflo_N_g907 (chymotrypsin-1)
