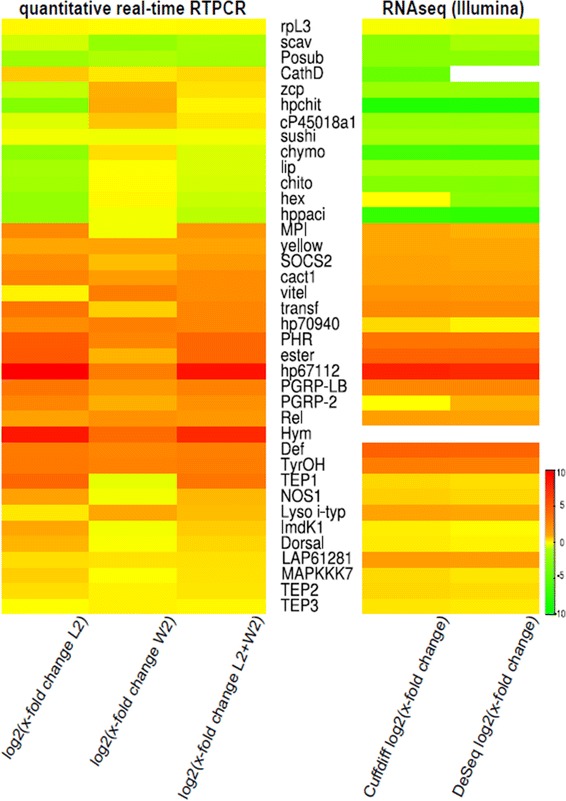
Fig. 9.

Comparison of expression of 37 selected genes based on the analysis of the Illumina sequencing data using Cuffdiff and DESeq and the corresponding qRT-PCR data. The heat map visualises the expression of 37 regulated immune genes 12 h after pricking of larvae and workers with a 1:1 mix of Gram-negative and Gram-positive bacteria in case of Illumina sequencing (Cuffdifflog2FC / DeSeq log2FC). The corresponding qRT-PCR analysis was performed separately in larvae and workers revealing a stage-specific gene regulation after immune challenge (log2(x-fold change L2 + W2)). Up and down-regulation are colour coded as given in the key highlighting common directions of gene regulation in the different data sets
