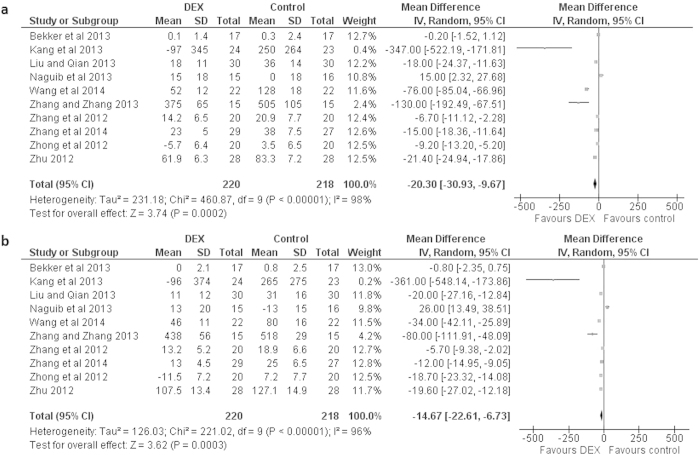
Figure 3. Forest graph showing the effect of dexmedetomidine on the changes from baseline in serum TNF-α levels.
(a) after surgery, and (b) a day after surgery. Boxes represent mean differences and line across each box represents respective 95% CI. Diamond represents overall effect size of the meta-analysis.

