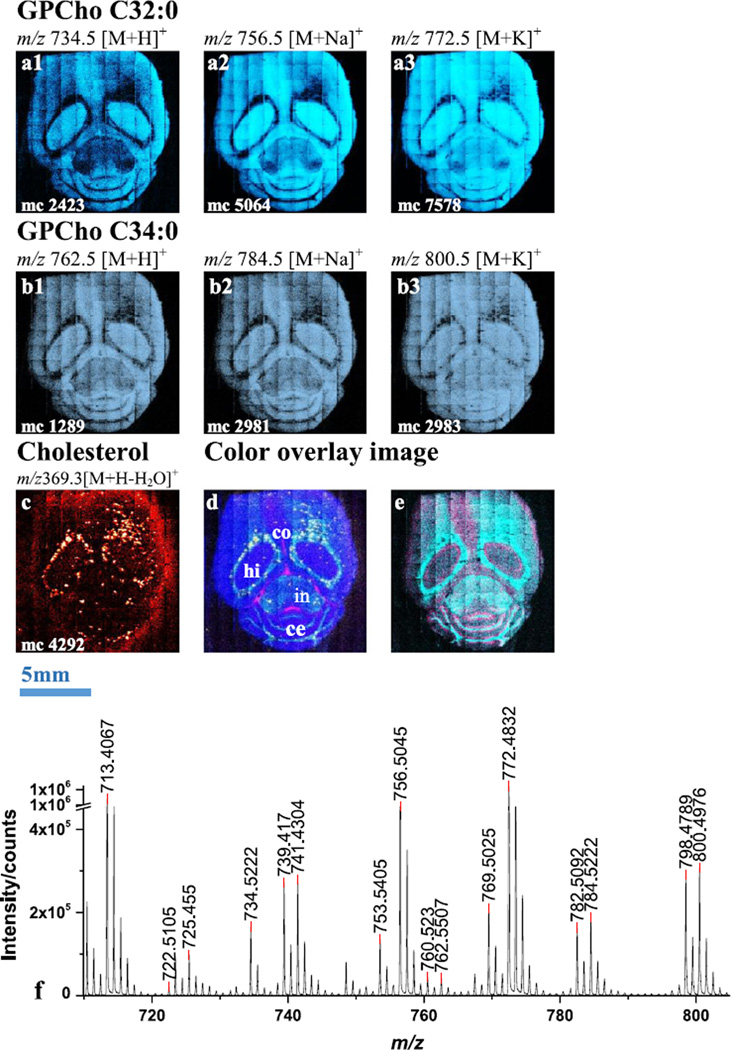
Figure 1.
Selected ion images and color overlay images of mouse brain section in positive SIMS mode using . a1, a2, a3), Single ion images of [M+H]+, [M+Na]+ and [M+K]+ at m/z 734.5, 756.5 and 772.5 from GPCho C32:0, respectively. b1, b2, b3), Single ion images of [M+H]+, [M+Na]+ and [M+K]+ at m/z 762.5, 784.5 and 800.5 from GPCho C34:0, respectively. c), Single ion image of cholesterol at m/z 369.3. d), Color overlay image of GPCho C32:0 at m/z 734.5 in blue, GPCho C34:3 at m/z 822.6 in turquoise, cholesterol at m/z 369.3 in yellow and glucosyl ceramide (d18:1/16:0) at m/z 722.5 in hot pink. With the major brain structures indicated (co-corpus callosum, ce-cerebellum, hi-hippocampus, in-internal capsule). e), Color overlay image of DAG ion at m/z 534.3 in hot pink and GPCho C36:3 at m/z 822.6 in turquoise. f), Positive SIMS spectrum collected from the tissue in mass range between m/z 720 and 810.

