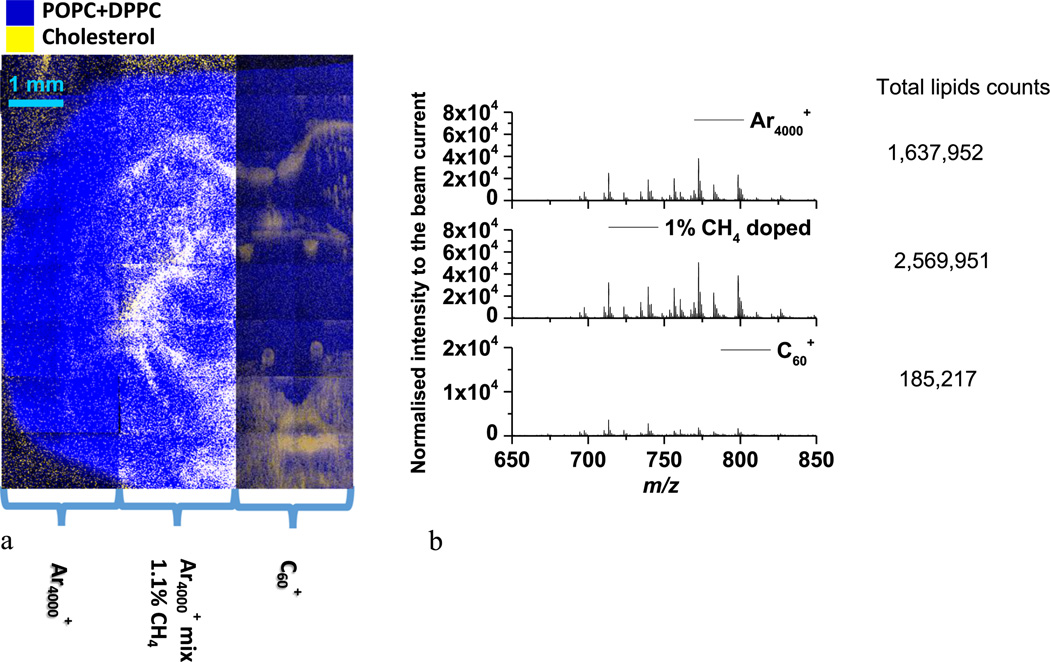
Figure 2.
Color overlay image of mouse brain section using different cluster beams. a) The three panels on the tissue section are subjected to the analyses using , 1.1% methane-doped and . The color overlay image shows the distribution of GPCho C34:1 and GPCho C32:0 in blue and cholesterol in yellow. b) The normalized spectra and total lipids counts from the three panels on the tissue section in mass range of m/z 650–850.

