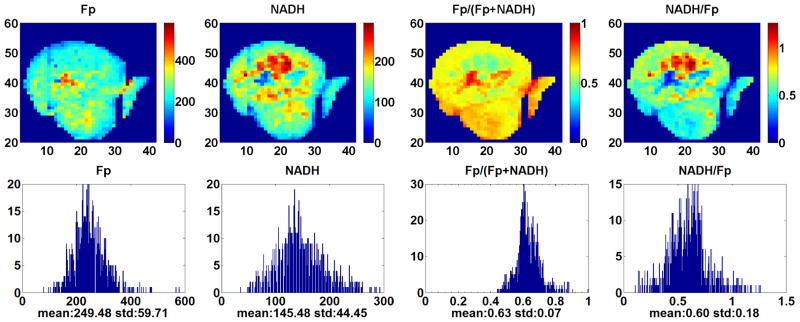
Fig. 2.
Typical redox images and corresponding histograms of the p53 wt group. The x and y axes represent the scanning matrix and the color bar is a reference to the colors in the corresponding image. Both Fp and NADH are in the unit of μM in reference to the corresponding solution standard of the analytes. The spatial resolution is 200 μm and the section depth is 1300 μm.

