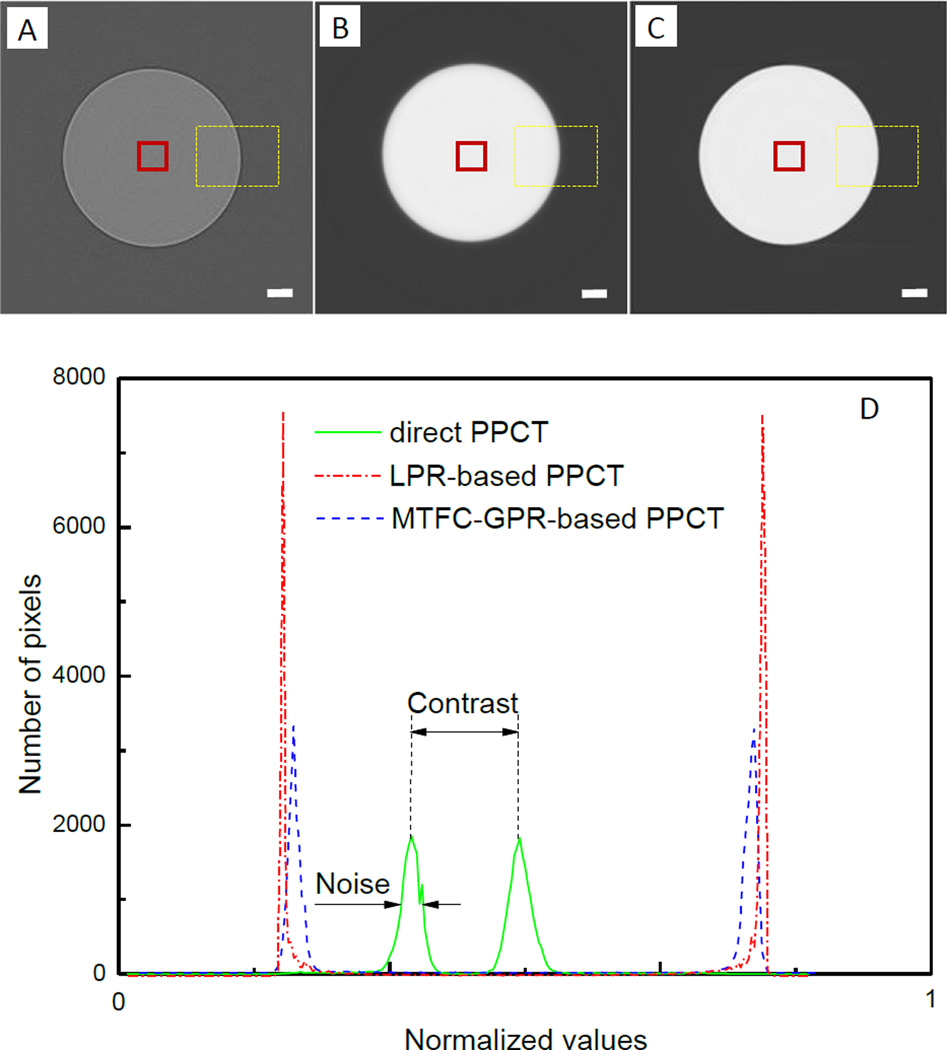
Fig. 4.
Tomographic Slices of the PMMA cylinder with direct PPCT (A), LPR-based PPCT (B), and MTFC-GPR-based PPCT (C); and (D) histograms of them in the corresponding ROIs marked with yellow dash-lines. The red solid-line ROIs used for calculating average reconstructed value. The length of scalar bar is 120µm.

