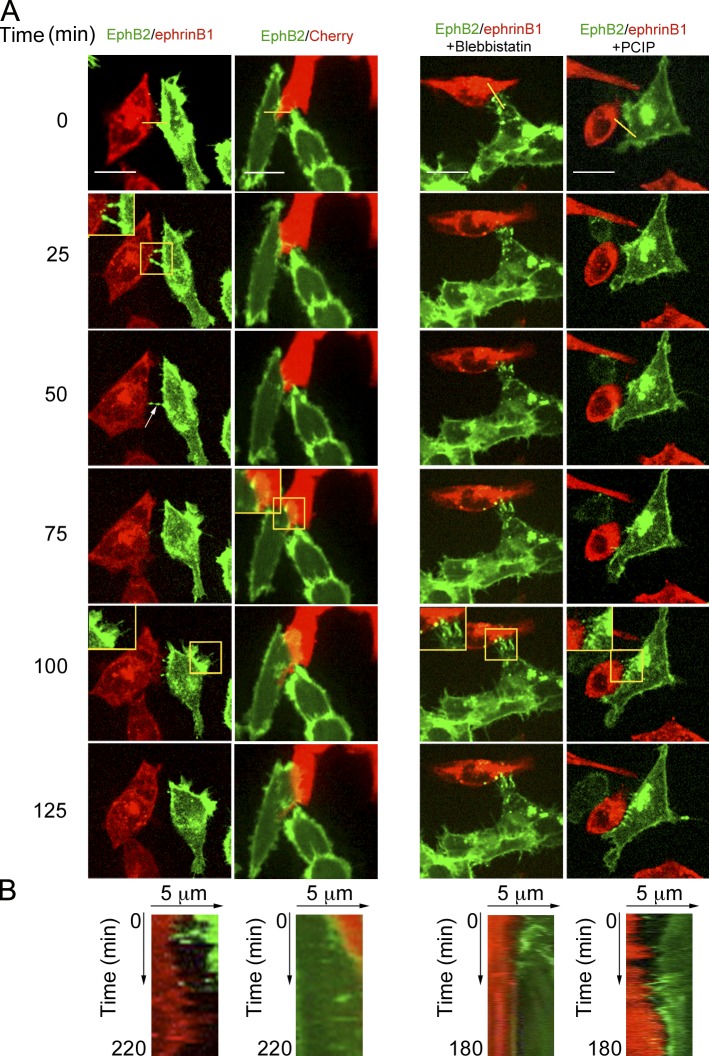
Figure 4.
Myosin 1 and NMM2 control HCT116 cell repulsion. YFP-EphB2-HCT116 cells were cocultivated with Cherry-ephrinB1-HCT116 or Cherry-HCT116 cells and treated or not with blebbistatin or PCIP. Representative sequences of merged YFP and Cherry fluorescent focal planes at the base of the cells are shown (see also Videos 1 and 2). Bars, 15 µm. The yellow boxes mark the regions enlarged by 1.4 and shown in the insets. The yellow lines on the merged images at time 0 represent the region of the kymographs shown in B. (B) Kymographs at the interface of EphB2 and the ephrinB1- or Cherry-expressing cells from Videos 1and 2. EphB2 cells remain in contact with ephrinB1 cells treated with blebbistatin or PCIP or with nontreated Cherry cells.

