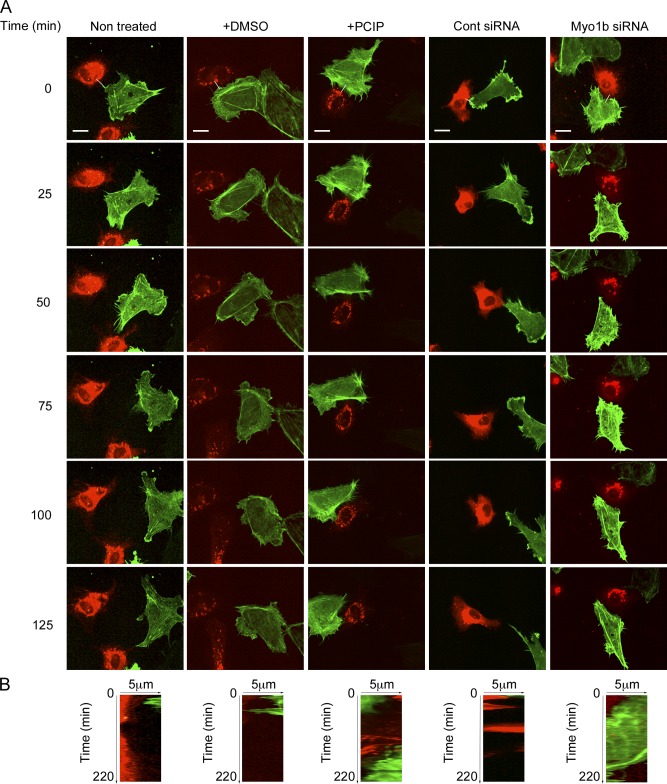
Figure 5.
Myosin 1 controls HUVEC repulsion. HUVECs expressing GFP-LifeAct transfected or not with control or Myo1b siRNA were cocultivated with HUVECs expressing Cherry-ephrinB1 and treated or not with PCIP or DMSO. Representative sequences of merged GFP and Cherry fluorescent focal planes at the base of the cells are shown (see also Videos 3 and 4). Bars, 15 µm. The white lines on the merged images at time 0 represent the region of the kymographs shown in B. (B) Kymographs at the interface of LifeAct and the ephrinB1 cells from Videos 3 and 4.

