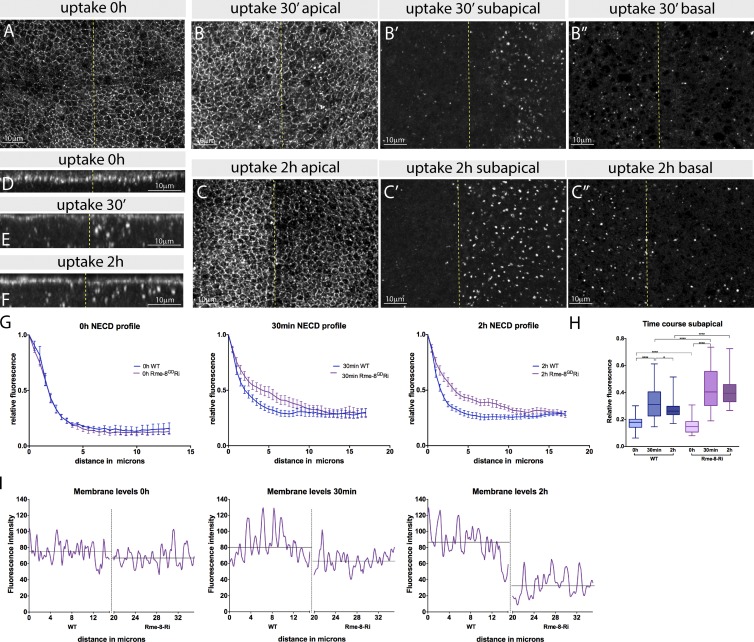
Figure 3.
Notch accumulates in subapical puncta in Rme-8–depleted cells. (A–C″) Antibody uptake assay to detect Notch trafficking (anti-NECD) in cultured wing discs. Different focal planes (apical [A, B, and C]; subapical [B′ and C′]; basal [B″ and C″]) from xy sections at 0 min (A), 30 min (B), or 2 h (C) after uptake. (D–F) xz cross sections of discs in A, B, and C, respectively. Notch–antibody complexes accumulate subapically in Rme-8-Ri (right) after 30 min but accumulate more basally in WT (left). (G) Quantification of fluorescence levels from Notch–antibody complexes according to distance from apical membrane in xz cross sections (apical levels were normalized to 1 for comparisons between samples). At 30 min and 2 h, more anti-NECD is detected in subapical regions with Rme-8-Ri compared with WT. Error bars represent the SEM. (H) Comparison between subapical levels of anti-NECD detected at different time points in wild-type (WT) and Rme-8 Ri tissue. Boxes indicate 25th to 75th percentiles, whiskers represent maximum and minimum values in the dataset, and lines show the median values. Asterisks indicate significance according to a one-way analysis of variance test; *, P = 0.05–0.01; ****, P < 0.0001. (I) Quantification of apical membrane anti-NECD in anterior (left, WT) versus posterior (right, Rme-8 Ri) of discs in A–C. The data shown are from a single representative disc; n = 10 for the experiment shown; the experiment was repeated two times with similar results. Lines show mean fluorescence at the membrane level within the specified compartment.

