Figure 2.
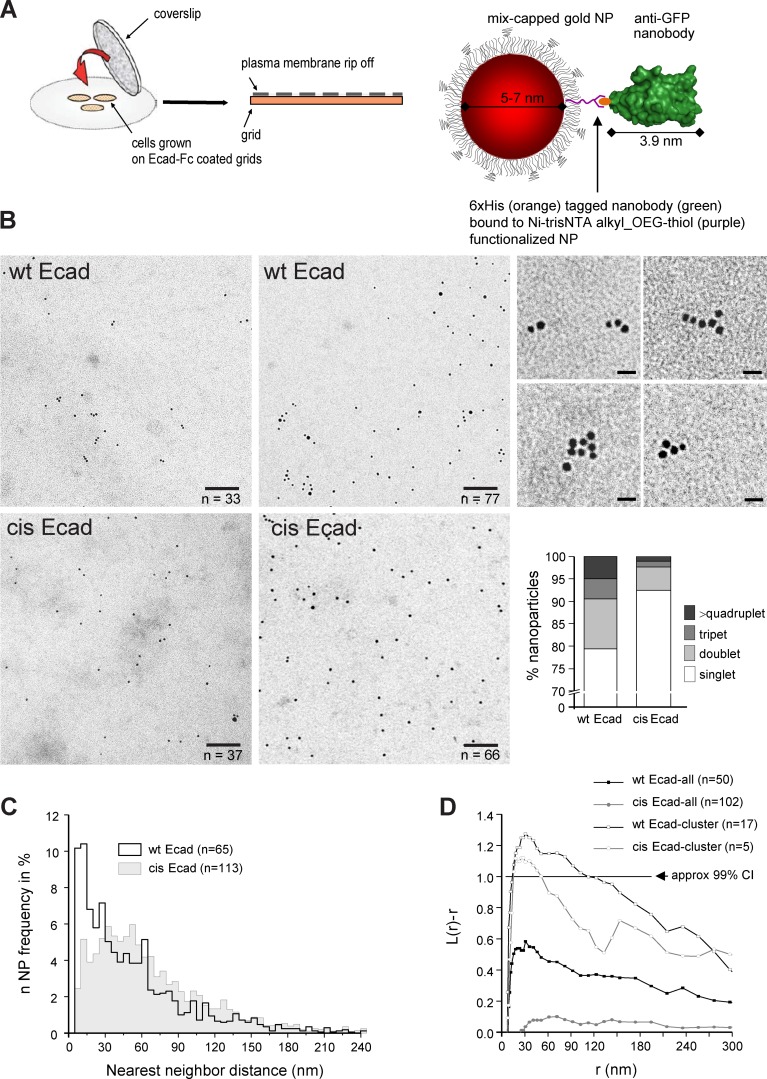
wt Ecad-GFP molecules are organized in nanometric arrays at the cell membrane. (A) Experimental approach. (left) Transfected cells were seeded at low density on Ecad-Fc–coated grids. After 2 h, the upper part of the cells were ripped off, leaving plasma membrane sheets corresponding to the bottom part of the cells (inner leaflet face up) on the electron microscopy grids (adapted from Hancock and Prior, 2005). Grids were then incubated with 5–7-nm-diameter mix-coated gold NPs (in red) conjugated to a single anti–GFP-NB (in green) and observed by TEM. As a control of binding specificity we observed only a few anti-GFP-NP on plasma membrane of nontransfected cells (not depicted). (B) TEM visualization of anti–GFP-NP on plasma membrane sheets of wt Ecad-GFP (wt Ecad) and cis-Ecad-GFP (cis Ecad) cells spread on Ecad-Fc. The four images on the left are representative images for wt Ecad and cis-Ecad, with around 35 and 70 NPs, left and right, respectively. The exact number of NPs in the picture is given at the bottom right. On the right is close-ups of NP aggregates found in the wt Ecad condition. Percentages of monomers, doublets, triplets, and higher oligomeric forms are given in the bottom right graph. χ2 test shows significant difference between wt and cis-Ecad expressing cells regarding the proportion of singlets and oligomers (P < 0.01). Bars: (left) 100 nm; (right) 15 nm. (C) Distribution of the center to center distance between each NP and its nearest neighbor. n, number of images analyzed per condition; Kolmogorov-Smirnov non-parametric test reveals a significant difference between both distributions (P = 0.006). (D) NP clustering for wt Ecad (black) and cis-Ecad (gray) expressing cells was characterized by K-function analysis. Curves with solid symbols correspond to the mean L(r) − r values calculated for all images. Curves with open symbols correspond to the mean L(r) − r values calculated for individual images presenting significant clustering. Values of L(r) − r above the 99% confidence interval (CI; black line) indicate significant clustering. Proportion of images having clustering of NP for wt and cis-Ecad is significantly different according to χ2 test (P < 0.01).

