Figure 7.
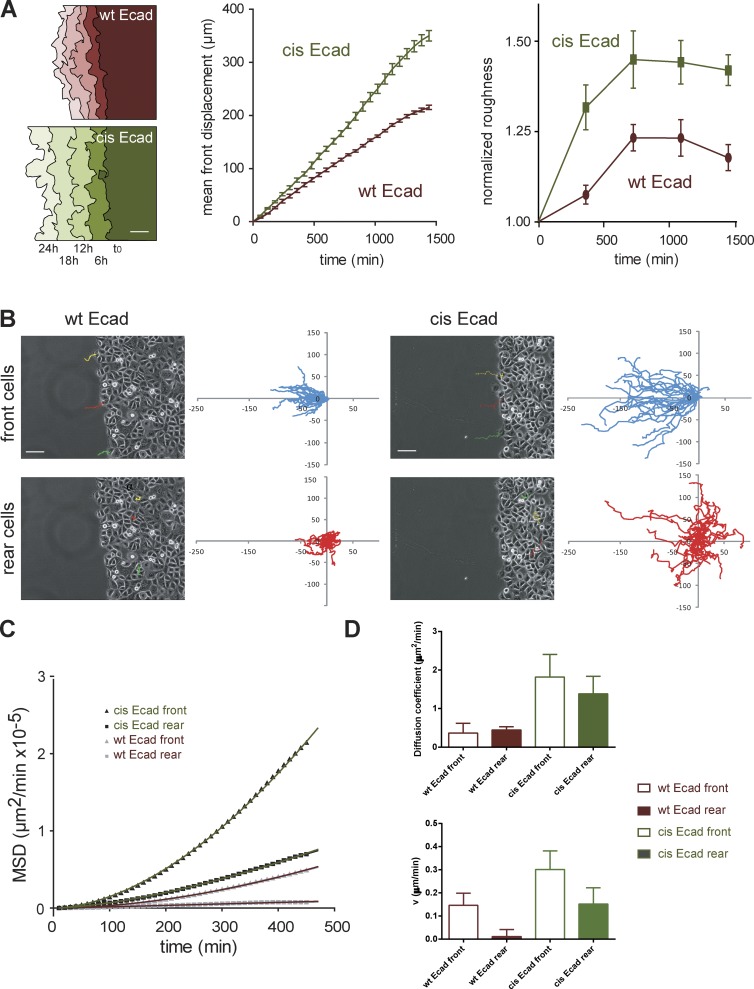
The disruption of Ecad cis-oligomerization impairs collective cell migration. Cells were phase-contrast imaged starting at the time the PDMS block was removed (t0) and for 24 h. (A, left) Examples of the evolution of the migration front in function of time for wt Ecad and cis-Ecad expressing cells. Bar, 50 µm. Plots show the front migration displacement in function of time (middle) and the normalized front roughness in function of time (right). n = 12 and 17 for wt Ecad and cis-Ecad expressing cells, respectively. (B) Single cell tracking was performed over the first 8 h of the 24-h movies. Phase-contrast images of wt Ecad (left) and cis-Ecad (right) expressing monolayers taken at t0 with superimposed 8-h trajectories of single cells at the front and rear (cells of the fifth row away from the edge). Bars, 50 µm. Plots of 8-h trajectories of front (blue curves) and rear (red curves) cells for wt Ecad and cis-Ecad expressing monolayers. Axes are scaled in micrometers; n = 48 and 36 trajectories for wt Ecad and cis-Ecad expressing cells, respectively. cis-Ecad cells migrate on significant larger distances than wt Ecad cells both at the front and rear. (C) MSD as a function of time for trajectories presented in B and fits by the equation (MSD = 4Dt2 + v2t2). D: Histograms showing the D and v values (± SEM) extracted from the fits for wt Ecad and cis-Ecad front and rear cells.

