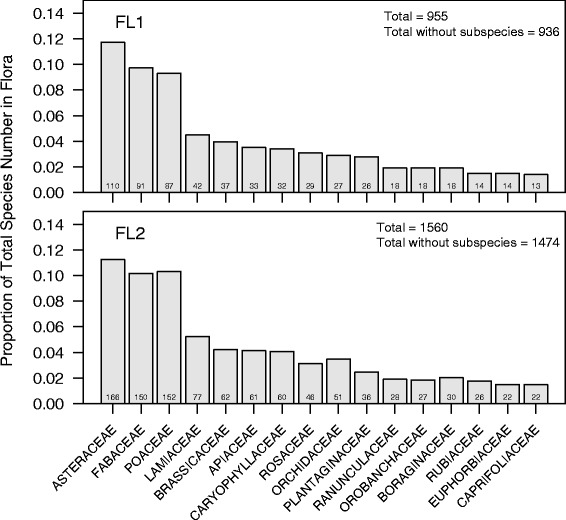
Fig. 2.

Proportion (and number) of species in the most represented families of the floras of the Amalfi Coast. The height of the bar represents the proportion of the flora contained in each of the top 16 families in FL1 (top panel), and the corresponding proportions of these same 16 families for FL2 appear in the bottom panel. The number of species in each family is written on the bar
