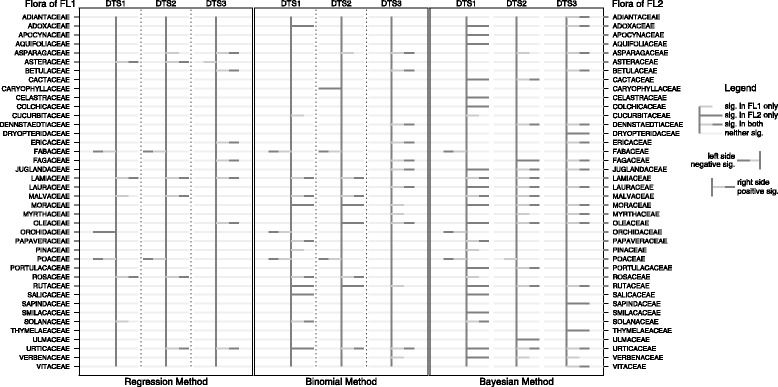
Fig. 4.

Linear regression, binomial method and Bayesian approach applied to the three datasets (DTS1-3) in relation to FL1 and FL2. Only families with over or under-use are showed. Results show significance in over or under-uses under different statistical tests. A darker line to the right indicates significant over-use of the plant family, while a darker line to the left indicates significant under-use. When both flora indicate similar results, the darker lines of each flora overlap with the line representing FL2 longer than that of FL1
