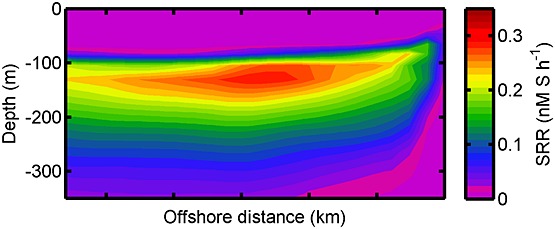
Figure 7.

Vertical section of the modeled sulfate reduction rate. The plot is averaged alongshore and over January in the last two years of the simulation. Note that the higher sulfate reduction rate at 100 – 150 km from the coast corresponds to the maximum export production at approximately the same distance offshore (50–150 km). There is no sulfate reduction rate occurrence above ∼100 m and below ∼350 m depth because of the presence of oxygen.
