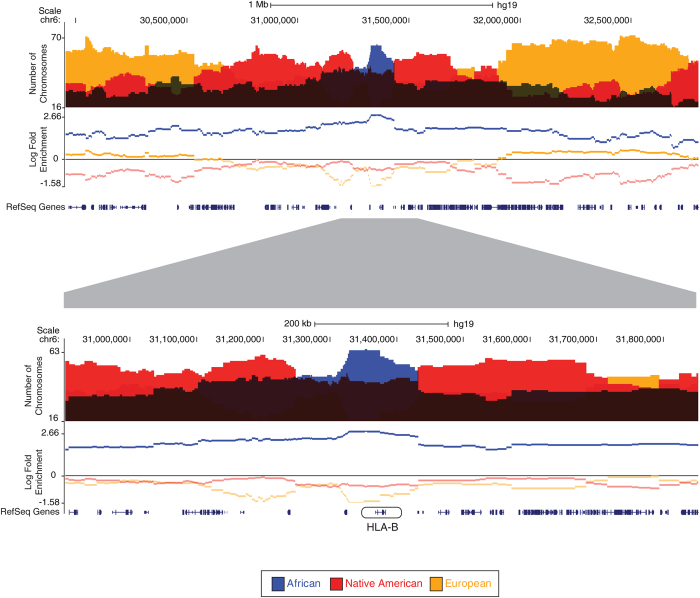
Figure 5. Example of an African-enriched region found in the MHC locus.
Population-wide chromosome counts from the three ancestry-components are shown above the genomic axis and log-fold enrichment values (observed counts/genomic average counts) for the ancestry components are shown below the axis. The upper panel shows a ~2.5 Mb region of the MHC locus on chromosome 6, and the lower panel shows a zoomed in view centered on the African ancestry-enriched gene HLA-B.

