Abstract
[1] The Nowcast of Atmospheric Ionizing Radiation for Aviation Safety (NAIRAS) is a real-time, global, physics-based model used to assess radiation exposure to commercial aircrews and passengers. The model is a free-running physics-based model in the sense that there are no adjustment factors applied to nudge the model into agreement with measurements. The model predicts dosimetric quantities in the atmosphere from both galactic cosmic rays (GCR) and solar energetic particles, including the response of the geomagnetic field to interplanetary dynamical processes and its subsequent influence on atmospheric dose. The focus of this paper is on atmospheric GCR exposure during geomagnetically quiet conditions, with three main objectives. First, provide detailed descriptions of the NAIRAS GCR transport and dosimetry methodologies. Second, present a climatology of effective dose and ambient dose equivalent rates at typical commercial airline altitudes representative of solar cycle maximum and solar cycle minimum conditions and spanning the full range of geomagnetic cutoff rigidities. Third, conduct an initial validation of the NAIRAS model by comparing predictions of ambient dose equivalent rates with tabulated reference measurement data and recent aircraft radiation measurements taken in 2008 during the minimum between solar cycle 23 and solar cycle 24. By applying the criterion of the International Commission on Radiation Units and Measurements (ICRU) on acceptable levels of aircraft radiation dose uncertainty for ambient dose equivalent greater than or equal to an annual dose of 1 mSv, the NAIRAS model is within 25% of the measured data, which fall within the ICRU acceptable uncertainty limit of 30%. The NAIRAS model predictions of ambient dose equivalent rate are generally within 50% of the measured data for any single-point comparison. The largest differences occur at low latitudes and high cutoffs, where the radiation dose level is low. Nevertheless, analysis suggests that these single-point differences will be within 30% when a new deterministic pion-initiated electromagnetic cascade code is integrated into NAIRAS, an effort which is currently underway.
Keywords: ionizing radiation, galactic cosmic rays, dosimetry
1. Introduction
[2] The Earth's geospace environment is continuously bombarded by high-energy charged particles that penetrate deep within the atmosphere. Energetic particle radiation that reaches the upper troposphere and lower stratosphere adversely affects aircraft microelectronic systems and potentially the health of aircrew and passengers [IEC, 2006; Wilson, 2000]. This paper focuses on human exposure to this ionizing radiation field at commercial aircraft altitudes.
[3] The type of particle radiation with sufficient energy deposition characteristics to adversely affect human health is the so-called cosmic rays. There are two sources of cosmic rays: (1) galactic cosmic rays (GCR), which originate from outside the solar system and are always present, and (2) solar energetic particles (SEP) (or solar cosmic rays), which are transient events associated with eruptions on the Sun's surface lasting for several hours to days [Wilson et al., 1991; Gopalswamy et al., 2003]. Cosmic radiation is effective at directly breaking deoxyribonucleic acid (DNA) strands in tissue or producing chemically active radicals in biological tissue that alter cellular function. Both of these effects can lead to cancer or other adverse health outcomes [Wilson et al., 2003, 2005a]. For example, adverse reproductive health disorders have been suggested by studies of female flight attendants [Aspholm et al., 1999; Lauria et al., 2006; Waters et al., 2000].
[4] Crews of commercial aircraft are classified as radiation workers by the International Commission on Radiological Protection (ICRP) [1991]. The United States (U.S.) National Council on Radiation Protection and Measurements (NCRP) reported that flight crews received the largest average effective dose in 2006 compared to other radiation workers monitored during the same study [NCRP, 2009]. A survey of radiation exposure of Air Canada pilots during solar cycle minimum showed that the majority of pilots received more than 1 mSv, which would require individual exposure assessment in some countries [Lindborg and Nikjoo, 2011], with the majority of the pilots receiving around 3 mSv and a few near 5 mSv [Bennett et al., 2013]. However, in most countries, aircrews are the only occupational group exposed to unquantified and undocumented levels of radiation over the duration of their career. Furthermore, the public and prenatal maximum exposure guidelines can be exceeded during a single SEP event for commercial passengers on intercontinental or polar routes, or even by frequent use (∼5–10 round-trip flights per year) of these high-latitude routes during quiescent GCR exposure [AMS, 2007; Copeland et al., 2008; Dyer et al., 2009; Mertens et al., 2012].
[5] There is a recognized need to link scientific knowledge of the atmospheric ionizing radiation field to aviation decision making with respect to aircrew and passenger exposure to cosmic radiation [Fisher, 2009]. Kataoka et al. [2011] discussed the need for and conceptual requirements of atmospheric cosmic radiation forecast models, with particular focus on SEP events, while Stassinopoulos et al. [2003] emphasized the need for continuous global mapping of the atmospheric ionizing radiation field in order to improve aircraft radiation model performance. Cosmic radiation access to the neutral atmosphere is susceptible to spatial-temporal variability associated with complex magnetospheric and interplanetary processes, such as geomagnetic storms and the so-called Forbush decrease, which are not well represented in current models [Spurný et al., 2004; Getley, 2004; Getley et al., 2005].
[6] Significant advances in quantifying and documenting aircraft radiation exposure has been made via the development of the Nowcast of Atmospheric Ionizing Radiation for Aviation Safety (NAIRAS) model [Mertens et al., 2010, 2012]. NAIRAS is a real-time, global, physics-based radiation model. It is a free-running physics-based model in the sense that no adjustment factors are applied to nudge the model into agreement with measurement data. The model includes both GCR and SEP sources of radiation exposure, and it incorporates the dynamical response of the geomagnetic field to variations in the interplanetary medium. NAIRAS real-time graphical and tabular products are streaming live from the project's public web site at http://sol.spacenvironment.net/∼nairas/ (or conduct an internet search for NAIRAS). The NAIRAS model accounts for the transport of cosmic rays through the heliosphere, Earth's magnetosphere, and their subsequent interactions and transport through Earth's neutral atmosphere. The NAIRAS model computes particle flux spectra, which are the fundamental physical quantities from which other useful quantities can be derived. For example, the model calculates key dosimetric quantities which are important for radiation protection applications and model verification and validation [Mertens et al., 2012].
[7] The objectives of this paper are threefold: (1) present a detailed description of the NAIRAS model GCR transport and dosimetry methodologies, (2) provide a global dose rate climatology for atmospheric GCR exposure representative of solar cycle maximum and solar cycle minimum conditions, and (3) conduct an initial validation of the NAIRAS model by comparing model predictions with onboard aircraft radiation measurements. Previous reports by Mertens et al. [2010] and Kress et al. [2010] have presented the NAIRAS model approach to computing SEP atmospheric radiation exposure and the concomitant storm time geomagnetic response, respectively. In this paper, the NAIRAS model GCR transport and dosimetry procedures are described and presented in section 2. The results in section 3 comprise the dosimetric climatology and the NAIRAS model validation. The dosimetric climatology is representative of NAIRAS GCR predictions over the full range of solar cycle activity and geomagnetic and atmospheric shielding conditions. The climatology is presented in terms of quantities which are used in radiation protection measurement and assessment of dose. NAIRAS model validation is conducted by comparing to tabulated reference data from measurements taken over the period 1992–2006. In addition, the NAIRAS model is compared with recent onboard aircraft radiation measurements that span the range of geomagnetic shielding conditions during the recent solar cycle minimum. Section 4 contains the summary and conclusions of this work.
2. Galactic Cosmic Ray Transport and Dosimetry Models
[8] The NAIRAS model is composed of coupled physics-based models to transport cosmic radiation through three distinct material media: the heliosphere, Earth's magnetosphere, and neutral atmosphere. The physics-based models are driven by real-time measurement data in order to specify boundary conditions on the cosmic radiation at the interface between the distinct material media or to characterize the internal properties of the material media through which the cosmic radiation propagates. The real-time measurements provide observational constraints on the physics-based models that improve accuracy and reliability.
[9] This section contains a detailed description of the NAIRAS physics-based models and input measurement data used to describe the transport of GCR through the heliosphere, magnetosphere, and neutral atmosphere. The transport of GCR through the heliosphere is discussed in section 2.1. Transmission of GCR particles through the magnetosphere is described in section 2.2. The transport and transmutation of GCR through the neutral atmosphere are presented in section 2.3. The method of characterizing the internal properties of the atmosphere relevant to cosmic radiation transport is summarized in section 2.4. Finally, the dosimetric quantities and the method of quantifying human radiation exposure and biological risk are described in section 2.5.
2.1 Heliospheric GCR Transport
[10] GCR are propagated from outside the heliosphere to 1 AU (astronomical unit) by solving a steady state, convective-diffusive transport equation which also includes adiabatic energy loss. A hybrid version of the Badhwar and O'Neill 2010 model [O'Neill, 2010], denoted H-BON10, is used to solve the transport equation. The composition of the GCR gas in the Badhwar and O'Neill model consists of 28 fully ionized nuclear isotopes from hydrogen (Z=1) through nickel (Z=28). In the hybrid version, the key transport coefficient in the BON10 model is parameterized using real-time, high-latitude neutron monitor data which have been fit to the solar modulation potential derived in the Badhwar and O'Neill 2004 (BON04) model [O'Neill, 2006]. This approach has produced good agreement between NAIRAS predictions and onboard aircraft radiation measurements, which are shown in section 3.
[11] The H-BON10 GCR model is described in the subsections below. The heliospheric transport equation solved in the H-BON10 model is presented in section 2.1.1. The outer heliosphere boundary condition on the GCR particle distribution and the parameterization of the transport coefficient in terms of neutron monitor data are described in section 2.1.2 The real-time implementation of the H-BON10 GCR model is presented in section 2.1.3.
2.1.1 Steady State Radially Symmetric Transport
[12] The specification of the GCR particle distribution at 1 AU in the H-BON10 model is based on steady state, radially symmetric transport through the heliosphere. Steady state is assumed to be achieved by a dynamical balance between inward diffusion, adiabatic energy loss, and outward convection by a constant solar wind speed. The equation that embodies this assumption is given by
 |
1 |
In the above equation, U is the differential number density of the GCR gas with respect to E, the kinetic energy per nucleon. The radial diffusion coefficient and constant solar wind speed are denoted κrr and Vsw, respectively. The variable r is the radial distance from the Sun and the Γ(E) factor is defined in (A11)-(A12).
[13] A detailed derivation of the GCR heliospheric transport equation and its reduction to a steady state, radial symmetric representation is presented in the Appendix. These details do not appear in previous publications on the Badhwar and O'Neill model [Badhwar and O'Neill, 1992, 1993, 1994, 1996; O'Neill, 2006, 2010]. Thus, the material in the Appendix will help elucidate the differences in the current GCR models used in space and atmospheric ionizing radiation applications [e.g., Mrigakshi et al., 2012; Matthiä et al., 2013; Zhao and Qin, 2013] and will also provide a reference description from which to facilitate future improvements in the physics of heliophysics GCR transport.
[14] In the Badhwar and O'Neill model, the steady state, radial transport equation in (1) is solved numerically given a specification of the key transport coefficient, which is defined as the ratio κrr/Vsw, and given the boundary condition on the differential number density. The transport coefficient and boundary condition are discussed in the next section.
2.1.2 Transport Coefficient Parameterization and Boundary Condition
[15] The boundary condition on the steady state radial transport equation in (1) is given in terms of the differential local interstellar spectrum (LIS) at the outer extent of the heliosphere. The differential LIS of each GCR particle has been known to vary as a power law in total energy per nucleon (E+E0) [O'Neill, 2006]. Comparisons between the BON04 and BON10 models and NASA's Advanced Composition Explorer (ACE) GCR spectral flux measurements have demonstrated improvements in model accuracy if a β factor is also included in the differential LIS, where β is the ratio of the charged particle velocity (w) to the speed of light in vacuum (c). Thus, the differential LIS is assumed to have a functional form given by [O'Neill, 2006; 2010]
| 2 |
The free parameters (γ, δ, and j0) are determined by fitting the solutions of the steady state radial transport equation in (1) to ACE measurements, as described in more detail below. The differential LIS spectrum has units of spectral flux and is related to the differential number density in (1) by
| 3 |
assuming a directionally isotropic distribution.
[16] The key transport coefficient in (1) is the ratio of the radial diffusion coefficient to the bulk solar wind speed. The diffusion coefficient can be expressed in terms of the scattering length λ such that κrr=(1/3)wλ, where λ(r,R,t) is a function of radial distance r, magnetic rigidity R, and time t [Axford, 1965; Gleeson and Axford, 1968]. Comparisons between solutions of the heliospheric GCR transport equation with GCR solar cycle modulation observed from surveys of neutron monitor data have shown that the spatial, rigidity, and temporal dependence of the scattering length can be factored into an analytical representation given by λ(r,R,t)=λ0(t)R(r/r0)2 for a heliospheric boundary defined to be rB=50 AU [Quenby, 1967]. By combining these results, the functional form of the transport coefficient implemented in the BON04 and BON10 models is taken to be
| 4 |
In the above equation, the bulk solar wind speed Vsw is set to 400 km/s for all time t; r is the distance from the sun in AU; t is time in years; k0 and r0 are constants given by 1.6×1021 cm2/s and 4 AU, respectively; R is the particle's magnetic rigidity in MV (megavolts), which can be computed from the particle's kinetic energy per nucleon as shown in (14); Φ is the so-called solar modulation potential; and β has been previously defined. Thus, the time-dependent behavior of the heliospheric GCR particle distribution is completely embedded in the solar modulation potential. The solar modulation potential is physically related to the energy that interstellar GCR nuclei must have in order to overcome the heliospheric potential field, established by the large-scale structure of the interplanetary magnetic field carried by the solar wind, and propagate through the heliosphere to the radius r.
[17] It is important to note that the solar modulation potential is not a unique quantity and should not be directly compared between different models. For example, the solar modulation potential in the Burger-Usoskin model contains the time dependence in the solution of the steady state radial GCR transport equation as a result of the force field approximation [Usoskin et al., 2005; Burger et al., 2000]. In addition to the simplifications leading to the transport equation in (1), the force field approximation neglects the streaming of the cosmic ray gas [Gleeson and Axford, 1968]. Thus, the solar modulation potential is model-specific. Meaningful comparisons of different GCR models are made by directly comparing the charged particle spectra for the same date and time.
[18] The remainder of this section summarizes the method of deriving the solar modulation potential in the BON04 model, which forms the reference solar modulation potential for developing the real-time H-BON10 model implemented in NAIRAS.
[19] The solar modulation potential in (4) was determined by fitting the steady state solution of the radial transport equation in (1) for a specified GCR nucleus to corresponding spectral flux measurements throughout the solar cycle, given a heliospheric outer boundary of rB=50 AU and the functional form for the boundary condition on the differential number density and transport coefficient parameterization in (2)-(4) [O'Neill, 2006, 2010]. Specifically, by using a well-known, fixed parameterization of the differential LIS, the solar modulation potential was determined by fitting the solution of the steady state radial transport equation for oxygen nuclei to measurements of the corresponding spectral flux. For energies below roughly 1 GeV (i.e., ∼50–500 MeV/nucleon), the measurement data were obtained from the Cosmic Ray Isotope Spectrometer (CRIS) instrument on the NASA/ACE satellite [Stone et al., 1998]. For higher energies (1–35 GeV), the model was fit to data from the C2 instrument on the NASA High Energy Astrophysical Observatory (HEAO-3) satellite [Englemann et al.].
[20] Once the solar modulation potential was derived based on the ACE/CRIS oxygen spectra, as described in the above paragraph, the free parameters (γ, δ, and j0) in the differential LIS for the remaining heavy-ion elements (i.e., lithium (Z=3) through nickel (Z=28)) were similarly determined by fitting the solutions of the steady state radial transport equation to the CRIS spectral flux measurements below 1 GeV and HEAO-3 spectral flux measurements above 1 GeV, as described above. The proton and alpha spectra in the BON04 model were fit to IMP-8 data; high-energy proton and alpha spectra were fit to the balloon-borne Isotope Matter-Antimatter Experiment (IMAX) measurements [Menn et al., 2000].
[21] The BON04 GCR model was extended beyond the time period of the ACE/CRIS measurements in the following way [O'Neill, 2006], since the ACE satellite has only been operational since 1997. First, the solar modulation potential was alternatively derived from the IMP-8 channel 7 (Z>8, high energy) measurements over three solar cycles from 1973 through 2001 and was calibrated against the solar modulation potential derived from ACE/CRIS for the period of data overlap (1997.6 to 2001.8). GCR flux comparisons using both sets of solar modulation potential correlated to within 98.9%. Next, linear fit coefficients were derived between the IMP-8 solar modulation potential and Climax neutron monitor count rates from 1973 to 2001. The solar modulation potential computed using the Climax neutron count rates correlated with the solar modulation potential derived from IMP-8 data to within 97%. Three sets of linear fit coefficients were derived corresponding to the three polarity states of the solar polar magnetic field: (1) positive solar cycle (outward directed magnetic field), (2) negative solar cycle (inward directed magnetic field), and (3) transition state (intermediate between positive and negative polarities with a high degree of modulation). The solar modulation potential determined from Climax neutron count rates, using the derived linear fit coefficients, was computed from 1958–2005 and made available with the BON04 code distribution. This extended Climax-based solar modulation potential, i.e., computed over the period 1958–2005, provides the reference solar modulation potential which is used to derive a real-time GCR model suitable for integration into the NAIRAS model.
2.1.3 Real-Time GCR Model
[22] The NAIRAS H-BON10 GCR model uses BON10 to solve the steady state radial transport equation in (1). Compared to BON04 [O'Neill, 2006], the BON10 model was developed using additional measurement data sets in deriving the solar modulation potential and the differential LIS fit coefficients [O'Neill, 2010]. In particular, the BON10 model included proton and Helium measurement spectra from the Balloon-borne Experiment with a Superconducting Spectrometer (BESS) in deriving the differential LIS fit coefficients. Moreover, the BON10 model uses International Sun Spot number to parameterize the solar modulation potential. However, parameterizing the solar modulation potential in terms of Sun Spot number is unsuitable for real-time applications. Consequently, in the NAIRAS H-BON10 model implementation, the solar modulation potential is parameterized by real-time, high-latitude neutron monitor count rates. This H-BON10 solar modulation potential parameterization was determined by cross-correlating the neutron monitor count rates with the Climax-based solar modulation potential derived from the BON04 model described in the previous section. The H-BON10 solar modulation potential parameterization is described in more detail below.
[23] Four neutron monitor sites were chosen to develop the solar modulation potential parameterization in the real-time NAIRAS H-BON10 GCR model. The neutron monitor sites are Thule (77.5°N, 290.5°E, Rvc=0.0 GV), Oulu (65.0°N, 25.5°E, Rvc=0.4 GV), Izmiran (55.5°N, 37.3°E, Rvc=1.7 GV), and Lomnicky (49.2°N, 20.2°E, Rvc=2.8 GV). These high-latitude sites were chosen to maximize the solar cycle modulation information embedded in the GCR spectrum, which must also be reflected in the ground-level neutron count rates. The neutrons detected on the ground are secondary particles produced by nuclear fragmentation reactions between the incident GCR particles and the constituents of the neutral atmosphere [Wilson et al., 1991]. The geomagnetic shielding of the incident GCR particles is low at high latitudes. As a result, at high latitudes where Rvc<1 GV, the sensitivity of the ground-level neutron counts rates to the lower energy region of the GCR spectrum (<∼10 GeV) is maximum. This is highly desirable since the lower energy range of the GCR spectrum is modulated the most by the interplanetary magnetic field carried by the solar wind, with the maximum in the GCR spectrum at 1 AU occurring around 500 MeV/n. Thus, solar modulation associated with solar cycle activity strongly influences the GCR spectrum with energies < ∼10 GeV [Mertens et al., 2012].
[24] The H-BON10 solar modulation potential parameterization was developed by deriving linear fit coefficients between the Climax-based solar modulation potential (denoted ΦCLIMAX) and the count rates measured at the four high-latitude neutron monitor sites mentioned above. Figure 1 shows the daily-averaged count rates from the four high-latitude neutron monitor stations. Also shown are the BON04 reference Climax-based solar modulation potential (ΦCLIMAX) and the BON04 solar modulation potential derived from NASA/ACE measurements (denoted ΦACE). Linear fits were derived between ΦCLIMAX and neutron counts rates obtained from each of the four high-latitude neutron monitor sites using all the data available from the beginning of operation of each site through 2005. For the Izmiran and Thule sites, this included more than four solar cycles of data. The Oulu data coverage was slightly less than this, while two solar cycles of data were available from Lomnicky. The derived fit coefficients are given in Table 1, and the solar modulation potential predicted by each neutron monitor site is shown in Figure 1.
Figure 1.
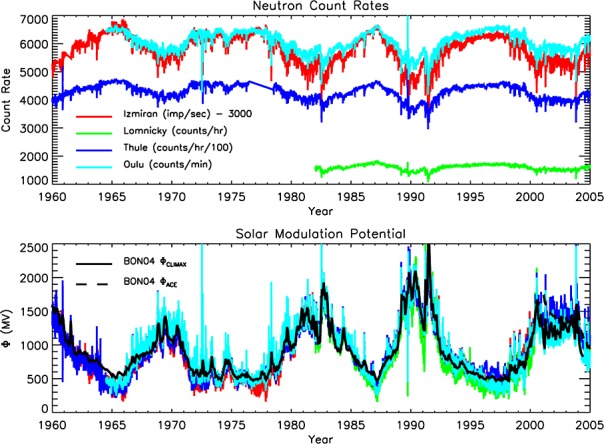
(top) Daily-average neutron monitor count rates from the Izmiran, Lomnicky, Thule, and Oulu sites. (bottom) Daily-average H-BON10 solar modulation potential (Φ(t)) determined from linear fits to the corresponding neutron monitor counts rates shown in the top. The BON04 reference solar modulation potentials determined from fits to the Climax neutron monitor data (ΦCLIMAX) and NASA/ACE measurements (ΦACE) are also shown.
Table 1.
Solar Modulation Fit Coefficients: Φ(t)=A●C(t)+B
| Neutron Monitor | Count Rate | Solar Magnetic Field | |||
|---|---|---|---|---|---|
| Site | Units (CR) | Polarity | A | B | Rª |
| Izmiran | imp/min | All | −0.759434 | 7613.908691 | 0.955779 |
| Izmiran | imp/min | Positive | −0.831245 | 8205.348633 | 0.975440 |
| Izmiran | imp/min | Negative | −0.712890 | 7199.992188 | 0.962824 |
| Izmiran | imp/min | Transition | −0.856442 | 8388.932617 | 0.990612 |
| Lomnicky | counts/h | All | −4.252285 | 7711.768066 | 0.964095 |
| Lomnicky | counts/h | Positive | −4.830692 | 8610.500000 | 0.988287 |
| Lomnicky | counts/h | Negative | −3.964344 | 7337.579590 | 0.973523 |
| Lomnicky | counts/h | Transition | −6.952554 | 11716.748047 | 0.997253 |
| Thule | counts/h/100 | All | −1.378323 | 6871.851562 | 0.924552 |
| Thule | counts/h/100 | Positive | −1.445073 | 7108.985840 | 0.952945 |
| Thule | counts/h/100 | Negative | −1.571804 | 7666.623047 | 0.968116 |
| Thule | counts/h/100 | Transition | −1.421140 | 6998.248047 | 0.991251 |
| Oulu | counts/min | All | −1.097910 | 7580.109375 | 0.970049 |
| Oulu | counts/min | Positive | −1.158424 | 7970.523926 | 0.980299 |
| Oulu | counts/min | Negative | −1.096173 | 7559.409668 | 0.966218 |
| Oulu | counts/min | Transition | −1.273056 | 8632.730469 | 0.969958 |
ªLinear correlation coefficient.
[25] As discussed several times before, the heliospheric GCR diffusion coefficient depends on the large-scale structure of the interplanetary magnetic field carried by the solar wind [Parker, 1965]. As a result, the transport coefficient in (4) will depend on the polarity of the Sun's polar magnetic field [O'Neill, 2006]. Consequently, to improve the accuracy of the neutron count rate fits to the reference ΦCLIMAX, the neutron data were sorted according to the solar polar magnetic field polarity. Thus, three sets of fit coefficients were derived: (1) positive solar cycle (outward directed field), (2) negative solar cycle (inward directed magnetic field), and (3) transition state (intermediate between positive and negative polarities with a high degree of modulation), as described previously for the ΦCLIMAX reference solar modulation potential. The parameterizations in Table 1 show higher correlations if the fits are performed separately for each solar polar magnetic polarity field state, as opposed to performing the fits over all data irrespective of the polarity state. It should be remembered that deriving the fit parameters for each solar polar magnetic field polarity state preserves the consistency with how the reference ΦCLIMAX was determined in the first place [O'Neill, 2006]. Nevertheless, the analysis reported by O'Neill [2006], along with the correlation coefficients shown in Table 1, demonstrate a dependence of the transport coefficient in (4) on the polarity state of the solar-interplanetary magnetic field, as one intuitively expects.
[26] For time periods after 1975, the polarity state of the Sun's polar magnetic field is determined from measurements taken by the Wilcox Solar Observatory (WSO) (http://wso.stanford.edu/Polar.html). Figure 2 shows the WSO low-pass filtered solar polar magnetic field strength data for the northern solar hemisphere, the negative of the southern hemisphere solar polar magnetic field strength, and the average solar polar magnetic field strength. When all three of these field strength data are positive, the Sun's polar magnetic field polarity is taken to be positive. Likewise, when all three of these field strength data are negative, the Sun's polar magnetic field polarity is taken to be negative. If at least one of these three field strength quantities has a different sign compared to another, the polarity of the Sun's polar magnetic field is taken to be in the transitional state, as shown in Figure 2.
Figure 2.
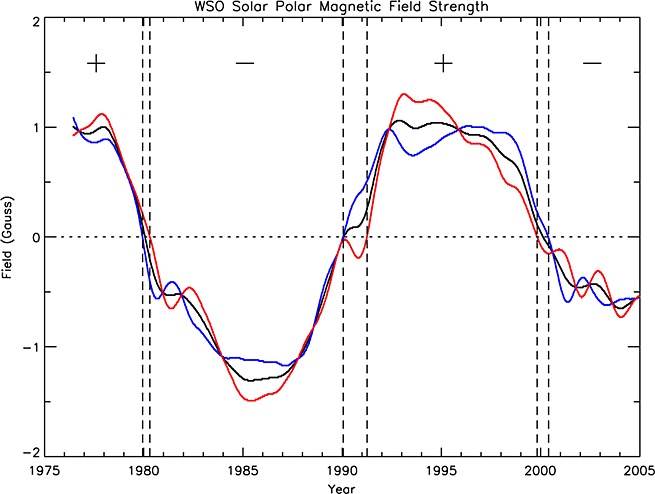
Solar polar magnetic field data taken by measurements from the Wilcox Solar Observatory (WSO). The blue line is the field strength of the northern solar hemisphere (N). The red line is minus the field strength of the southern solar hemisphere (−S). The black line is the average solar field strength of the Northern and Southern Hemispheres (A=(N−S)/2). Different solar polar magnetic polarity states are separated by vertical dashed lines. The positive and negative polarity states are denoted plus and minus, respectively. The transitional states are the regions of finite temporal width that separate the positive and negative states.
[27] For time periods prior to 1975, the solar polar magnetic field polarity is determined from a combination of the solar activity cycle duration (http://en.wikipedia.org/wiki/List\_of\_solar\_cycles), as specified by International Sunspot Numbers (ftp://ftp.ngdc.noaa.gov/STP/SOLAR_DATA/SUNSPOT_NUMBERS/INTERNATIONAL/monthly/MONTHLY), and the definition of the Hale cycle [Murphy et al., 1994].
[28] Once the polarity of the solar polar magnetic field is determined, the appropriate sets of linear fit coefficients in Table 1 are selected to compute, separately, solar modulation potentials for as many of the four high-latitude neutron monitor data as are available for the time period in question. These solar modulation potentials are averaged, and the average value is used to specify the transport coefficient in (4). Finally, given the transport coefficient, the GCR spectra at 1 AU for each nucleus from hydrogen (Z=1) through nickel (Z=28) is obtained by solving the steady state radial transport equation in (1). This comprises the key features of the H-BON10 GCR model.
2.2 Magnetospheric GCR Transport
[29] The H-BON10 model described in the previous section transports the cosmic ray gas through the heliosphere to 1 AU and specifies incident GCR spectral flux outside of the Earth's magnetosphere. The lower energy cosmic rays are essentially attenuated by the geomagnetic field, which includes an internal field component plus magnetospheric contributions, as these charged particles are transported through the magnetosphere and into the neutral atmosphere. The attenuation of charged particle transport by the geomagnetic field is a form of momentum shielding in the sense that the lower energy particles are deflected back out to space via the Lorentz force.
[30] GCR transport through the magnetosphere can be described in terms of a geomagnetic transmission function such that
| 5 |
In the above equation, Φi(rB,Ω,E) is the spectral flux of GCR particle type i at the top of the neutral atmosphere (rB) moving in direction Ω with energy E; Ji(E) is the isotropic spectral flux of GCR particle type i with energy E outside the magnetosphere (i.e., (2), given by the H-BON10 model described in the previous section; and Ti(rB;Ω,E;Ω′,E′) is the geomagnetic transmission function, which represents the probability that a charged particle type i with energy E′ and moving in direction Ω′ outside the magnetosphere will be moving in direction Ω with energy E at the top of the neutral atmosphere (rB) after propagating through the magnetosphere.
[31] The geomagnetic transmission function is assumed to be factorable into a product of a spatial projection function and an energy transmission function, such that
| 6 |
where H(x) is the Heavyside step function defined by H(x)=1 if x>0; otherwise, H(x)=0. From the above representation of the energy transmission function, a charged particle i with energy greater than a cutoff energy Ec,i is transported without energy loss through the magnetosphere to position rB in the neutral atmosphere with direction Ω. On the other hand, particle i with energy less than or equal to Ec,i does not arrive at location rB with direction Ω. The geomagnetic cutoff rigidity Rc in (6) is the canonical variable in quantifying the momentum shielding effect of the geomagnetic field. Once the cutoff rigidity is known, the cutoff energy Ec,i for any charged particle i can be easily computed. The geomagnetic cutoff rigidity will be discussed in more detail below.
[32] The spatial projection function in (6) is assumed to have the following form
| 7 |
where
| 8 |
The angles θ and φ in the above equation are the polar and azimuthal angles, respectively, for a coordinate system with the z axis directed along the local vertical direction at location rB. By projecting along the local vertical direction rB, an effective 1-D transport procedure can be developed. In this case,
| 9 |
By substituting (6)–(7) and (9) into (5), the specification of the incident GCR spectral flux at the top of the neutral atmosphere along the local vertical direction becomes
| 10 |
Since the GCR particles outside the magnetosphere have been projected along the local vertical axis, the cutoff energies and rigidity in (10) are given in terms of vertical cutoffs, as denoted by the subscript v.
[33] The relevance of the geomagnetic cutoff rigidity in quantifying charged particle transport through the magnetosphere is evident by considering the motion of a charged particle in a magnetic field. The trajectory of a charged particle in a magnetic field is determined by solving Newton's equation of motion with the external force supplied by the Lorentz force. For a positively charged particle, the equation of motion is
| 11 |
in cgs units. The quantity × designates the vector cross product. The charged particle momentum and velocity are p and v, respectively, and B is the magnetic flux density. The magnitude of the charge of an electron is denoted e, and Z is the number of electron charge units. Equivalently, the equation of motion in (11) can be written as
| 12 |
where the  symbol denotes units vectors, and
| 13 |
is defined as the rigidity. The canonical aspect of the rigidity is now evident from the form of the equation of motion given in (12): Charged particles with the same rigidity follow identical trajectories for a given magnetic flux density (B).
[34] Based on the above discussion, the vertical geomagnetic cutoff rigidity Rvc(rB) in (10) is the minimum rigidity that a vertically arriving charged particle must have to reach the location rB. Consequently, charged particles with energies less than the cutoff energy (Evc,i) will be deflected by the Lorentz force and not reach the location rB in the vertical direction. The cutoff energy for each charged particle type i with charge number Zi and mass number Ai is calculated from the canonical cutoff rigidity using the relativistic energy equation, such that
 |
14 |
where Evc,i is the cutoff kinetic energy per nucleon (MeV/n) for particle type i, Rvc is vertical geomagnetic cutoff rigidity (MV), c is the speed of light in vacuum, and amu =931.5 MeV/c2 (atomic mass unit). In effect, the geomagnetic field filters out lower energy charged particles as they are transported through the magnetosphere and into the neutral atmosphere.
[35] NAIRAS real-time vertical geomagnetic cutoff rigidities are computed from numerical solutions of charged particle trajectories in a geomagnetic field that includes both the internal magnetic field and the dynamically varying magnetospheric magnetic field [Kress et al., 2010; Mertens et al., 2010, 2012]. The specification of the geomagnetic field due to Earth's internal field source is provided by the International Geomagnetic Reference Field (IGRF) model [Finlay et al., 2010]. The real-time, dynamical response of the magnetospheric magnetic field to solar wind conditions and the interplanetary magnetic field is provided by the semi-physics-based TS05 model [Tsyganenko and Sitnov, 2005]. A detailed description of the real-time, dynamic geomagnetic cutoff model is given by Kress et al. [2010], while Mertens et al. [2012] provides a summary of computing cutoff rigidities in the IGRF field.
[36] Figure 3 shows the global grid of vertical geomagnetic cutoff rigidities at 20 km in the internal IGRF magnetic field. The cutoffs are shown for 2008, the year of NAIRAS model comparisons with onboard aircraft radiation measurements presented in section 3.3. The vector cross product in the Lorentz force in (11) has the following effect: charged particle motions perpendicular to magnetic field lines will experience the maximum deflection; particle motions parallel to the magnetic field will experience no deflecting force whatsoever. Consequently, the maximum cutoff rigidity is at the magnetic equator and the minimum cutoff rigidity is at the magnetic poles. The longitudinal variations in the cutoff rigidity arise from two sources: (1) geocentric offset and relative tilt of the magnetic dipole, with respect to the Earth's rotational axis, and (2) the nondipolar contributions to the internal geomagnetic field.
Figure 3.
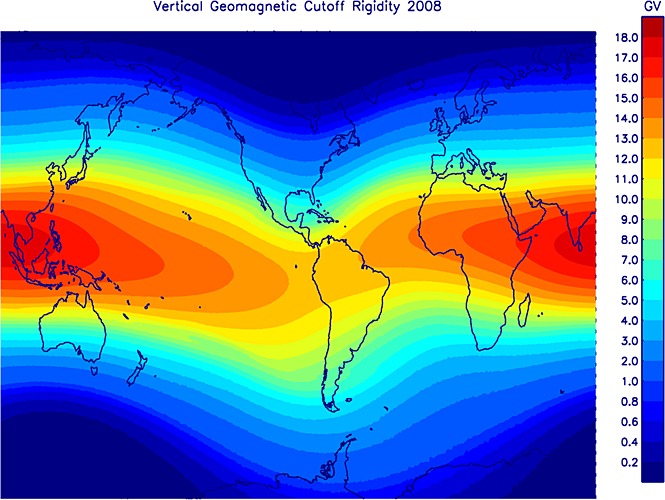
Global grid of vertical geomagnetic cutoff rigidities (GV) calculated from charged particle trajectory simulations in the IGRF field for 2008.
[37] Decadal and zonal-average vertical geomagnetic cutoff rigidities in the IGRF field are shown in Figure 4. From this figure it is evident that a vertically arriving proton at the equator must have a kinetic energy of ∼15 GeV in order to have access to the neutral atmosphere. In the polar regions, vertically arriving charged particles are parallel to the magnetic field lines. Therefore, the cutoff rigidity is zero; particles of all energies have access to the neutral atmosphere in this case. The slight temporal changes in the cutoffs are due to a combination of shifts in the location of the Earth's magnetic poles and a weakening of the magnetic dipole field. On geological timescales, these changes are quite rapid. In regards to the dose rate climatology presented in section 3.1, the changes are small. Thus, annual to decadal variations in GCR dose rates at fixed pressure levels are dominated by changes in the level of solar cycle activity rather than changes in geomagnetic cutoff.
Figure 4.
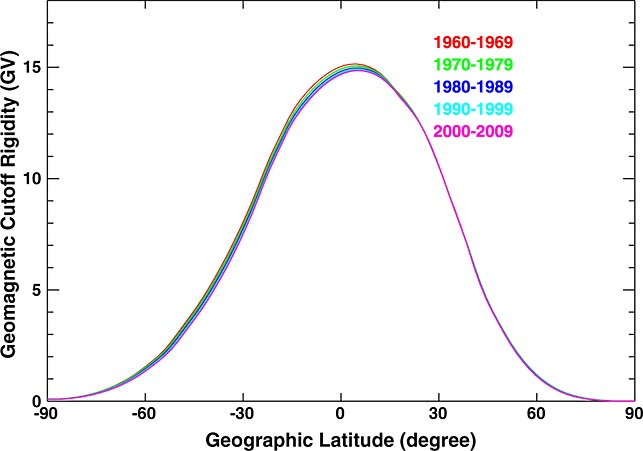
Zonal-averaged vertical geomagnetic cutoff rigidity (GV) computed from charged particle trajectory simulations in the IGRF field.
2.3 Atmospheric GCR Transport
[38] The transport of cosmic rays through the neutral atmosphere is described by a coupled system of linear, steady state Boltzmann transport equations [Wilson et al., 1991]. The transport equation for the spectral flux Φj(x,Ω,E) of particle type j is given by [Mertens et al., 2012]
 |
15 |
where σj(E) and σjk(Ω,Ω′,E,E′) are the projectile-target macroscopic interaction cross sections. The σjk(Ω,Ω′,E,E′) are double-differential particle production cross sections that represent all processes by which type k particles moving in direction Ω′ with energy E′ produce a particle of type j moving in direction Ω with energy E, including radioactive decay processes. The total interaction cross section σj(E) for each incident particle type j is
| 16 |
where the first term refers to projectile collisions with atomic electrons of the target medium, the second term refers to elastic ion-nucleus scattering or elastic neutron-nucleus scattering, and the third term contains all relevant nuclear reactions. The corresponding differential cross sections are similarly ordered.
[39] The principal mechanism for atomic interactions between the cosmic ray ions and the target medium of the atmospheric constituents is ionization and/or atomic excitation. This process is represented by the first term in (16). The result of this interaction is the transfer of energy from the projectile ion to the atomic electrons of the target medium via the Coulomb impulse force. Since the projectile ion mass is much greater than the electron mass, the ion travels essentially in a straight line as it looses energy through ionization and atomic excitation of the target medium. The ionization and atomic excitation energies, as well as the energies of ejected orbital electrons, are usually small in comparison to the incident ion kinetic energy. As a result, the ionization/excitation energy loss processes by which the projectile ions transfer energy to the target bound and/or ejected orbital electrons can be considered continuous. Because of this so-called continuous slowing down approximation (CSDA), the energy dE which is lost by the incident ion and transferred to the orbital electrons of the target medium by ionization and/or atomic excitation within an element of path dx is given by the stopping power, S=−(dE/dx) [Tai et al., 1997].
[40] The range of an ion is the mean path length traveled in the target medium before coming to rest after losing its initial kinetic energy through ionization and/or atomic excitation energy loss. In the CSDA, the range is defined by
 |
17 |
where Aj is the atomic mass number of ion particle type j. The above equation is referred to as the range-energy relation.
[41] Two approximations are made to the total ion-target interaction cross section in (16). First, elastic ion-nucleus scattering is neglected for cosmic ray transport through the atmosphere [Mertens et al., 2012]. Second, the CSDA is invoked in the representation of atomic ion-electron energy transfer collisions. As a consequence of these two approximations, the coupled Boltzmann transport equations in (15) can be expressed, alternatively, as
 |
18 |
where
| 19 |
The  in the above equations denote a differential operator acting on the spectral flux.
[42] The differential operator in (18) can be inverted using the method of characteristics in order to transform the integro-differential equation into a Volterra-type integral equation [Wilson, 1977]. As a result, the integral equation for cosmic ray transport through a material medium is given by
 |
20 |
In the above equation, ΓΩ,x is a position vector of a point on the boundary surface and Eγ is given by
| 21 |
The  operator in (21) is the inverse operation of obtaining the energy given the range using the range-energy relation in (17). The expression for the integral cosmic ray transport equation in (20) was made compact by introducing the total nuclear survival probability, which is defined by
 |
22 |
The first term in (20) describes the attenuation of the spectral flux specified at the boundary as a result of transport through the target medium. For atmospheric cosmic ray transport, the boundary specification is defined as the cosmic ray flux transported through the heliosphere and magnetosphere and incident at the top of the atmosphere (TOA), as discussed in sections 2.1 and 2.2. These incident TOA cosmic ray ions are then attenuated by ionization energy loss (S(E)) and nuclear absorption (P(E)), as indicated by the first term in (20). The second term in (20) describes the generation of type j particles from projectile-target nuclear fragmentation reactions by type k particles. The second term in (20) includes the production of type j particles from type k particles at all intervening positions between the boundary surface and the position of observation, accounting for the attenuation by ionization energy loss and nuclear absorption in between the point of production of a type j particle and the observation point.
[43] The coupled cosmic ray integral transport equations in (20) are solved in the NAIRAS model using the NASA deterministic High Charge (Z) and Energy Transport code (HZETRN) version 2010. Details of the early analytical and computation approaches to solving (20) are given by Wilson et al.[1991, 1995a, 1997, 2005b]. The stopping power parameterization used in HZETRN is described by Tai et al. [1997]. The nuclear cross sections for neutron and proton interactions are described extensively in Wilson et al. [1989]. The model for calculating the heavy-ion nuclear fragmentation cross sections are described by Wilson et al. [1995b] and Adamczyk et al. [2012].
[44] The computation methods employed in HZETRN to solve the coupled cosmic ray integral transport equations in (20) are summarized below. The details are given in the references. The numerical procedures fall into two categories based on the fundamental physics of cosmic ray projectile-target nuclear interactions. The first category is heavy-ion transport. Ion beam experiments have shown that projectile fragments have a velocity and direction very near to that of the incident heavy-ion projectile [Wilson, 1977; Wilson et al., 1995a]. The observation of forward directed projectile fragments is the basis of the so-called straight-ahead approximation, where the integral over solid angle in (20) is neglected and the transport is reduced to one dimension along the direction of the incident heavy-ion beam. Moreover, the observation of equal velocity between the heavy-ion projectile and the projectile fragment suggests a delta function energy dependence in the projectile fragment production cross section, which effectively eliminates the integral over dE′′ on the right-hand side of (20).
[45] In addition to the approximations discussed in the previous paragraph, the target fragments are produced at low energy and distributed nearly isotropically. At low energy, the target fragments do not travel far before coming to rest due to ionization energy loss. These observations justify a decoupling of the target and projectile fragments in the source term on the right-hand side of (20). The advantage of this decoupling is that the target fragments can be neglected in the heavy-ion transport procedure. The absence of the target fragments in the heavy-ion transport solution means that the summation over k type particles in (20) involves only projectiles with masses greater than the mass of the type j particle (i.e.,  ). These approximations enable a rapidly converging self-consistent solution of projectile fragment heavy-ion transport using backsubstitution and perturbation theory. The contribution of the target fragments to the dosimetric quantities is included using the approach described by Wilson et al. [1993]. Slaba et al.[2010a, 2010b] have recently made significant improvements in the accuracy and computational efficiency of HZETRN's heavy-ion numerical transport procedures.
[46] The numerical transport solution for light-particle trajectories does not permit the same approximations that were employed in solving (20) for heavy-ion transport. In HZETRN, light particles are defined as particles with charge number Z≤2 and mass number A≤4. There are six light particles: five charged particles (protons, deuterons, tritons, helium-3, and helium-4) and neutrons. One of the added complexities in the numerical solution of light-particle transport is that the equal velocity relationship between projectile and projectile fragments is no longer valid. Thus, the energy integral over dE′′ on the right-hand side of (20) must be explicitly evaluated. In addition, the light-particle numerical transport procedure must include both the projectile and target fragments. Finally, the straight-ahead approximation cannot be employed either, which means that the integral over solid angle in (20) must be evaluated. Directional effects are especially important for low-energy neutron transport.
[47] Updates to HZETRN's numerical solution of light-particle transport have recently been made by Slaba et al. [2010a, 2010b, 2010c, 2010d], which have significantly improved accuracy and computation efficiency. The basic approach is to decompose the light-particle spectral flux into an isotropic component and a straight-ahead component. The transport solution for the straight-ahead component is described by Slaba et al.[2010a, 2010b]. The neutron spectral flux itself is decomposed into semi-isotropic forward and backward components. The numerical approach for this so-called directionally coupled forward-backward neutron transport scheme is described by Slaba et al. [2010c, 2010d]. These same references also describe the solution of the charged particle isotropic component: the key approximation is to assume that the source term originates from nuclear fragmentation reactions between the target medium and the low-energy semi-isotropic neutrons, which turns out to be a good approximation [Slaba et al., 2010a, 2010b].
[48] In the NAIRAS model implementation of HZETRN, there are 59 coupled transport equations that are numerically solved to represent GCR transport through the atmosphere. This set includes transport equations for neutrons and fully ionized nuclear isotopes from protons (Z=1, A=1) through nickel (Z=28, A=58). Efforts are currently underway to couple deterministic pion-electromagnetic (π/EM) cascade models with HZETRN [Norman et al., 2012, 2013; Slaba et al., 2013]. A preliminary discussion of the influence of π/EM processes on NAIRAS predictions is given in section 3.3. NAIRAS transport methods for SEP events is described by Mertens et al.[2010, 2012].
2.4 Meteorological Data
[49] This section briefly summarizes the important characteristics of the atmospheric state that are relevant to cosmic ray transport. Incident charged particles are shielded by the atmosphere itself, which is a function of the overhead mass at a given altitude. Subdaily global atmospheric depth is derived from the following: (1) pressure versus geopotential height data and (2) pressure versus temperature data. These data are obtained from the National Center for Environmental Prediction (NCEP)/National Center for Atmospheric Research (NCAR) Reanalysis 1 project [Kalnay et al., 1996]. This project utilizes a state-of-the-art analysis/forecast system to perform data assimilation using past data from 1948 to the present. The data products are available four times daily: 0, 6, 12, and 18 UT. The spatial coverage includes a 2.5×2.5° horizontal grid, covering the entire globe, and 17 pressure levels in the vertical direction, from approximately the surface (1000 hPa) to the middle stratosphere (10 hPa).
[50] NCAR/NCEP pressure versus geopotential height data are extended in altitude above 10 hPa using the Naval Research Laboratory Mass Spectrometer and Incoherent Scatter (NRLMSIS) model atmosphere [Picone et al., 2002]. NCAR/NCEP and NRLMSIS temperatures are smoothly merged at 10 hPa at each horizontal grid point. NRLMSIS temperatures are produced at 2 km vertical spacing from the altitude of the NCEP/NCAR 10 hPa pressure surface to approximately 100 km. The pressure at these extended altitudes can be determined from the barometric law using the NRLMSIS temperature profile and the known NCAR/NCEP 10 hPa pressure level, which assumes the atmosphere is in hydrostatic equilibrium and obeys the ideal gas law. Finally, the altitudes and temperatures are linearly interpolated in log pressure to a fixed pressure grid from 1000 hPa to 0.001 hPa, with six pressure levels per decade. The result from this step is pressure versus altitude at each horizontal grid point from the surface to approximately 100 km.
[51] The relevant vertical coordinate in atmospheric ionizing radiation transport is atmospheric depth. Atmospheric depth (g/cm2) at each horizontal grid point and altitude level is computed by integrating the mass density vertically from a given altitude to the top of the atmosphere. The mass density is computed from the ideal gas law using the temperature and pressure data at each altitude level. This step produces a 3-D gridded field of atmospheric depth.
[52] Representative atmospheric data are shown in Mertens et al.[2010, 2012].
2.5 Dosimetric Quantities
[53] The energy deposited in a target medium by the radiation field of particle j is the dose, which is given by
 |
23 |
In the above equation, Sj(E) is the target stopping power for particle j (Mev/g/cm2), Fj(x,E) is the spectral fluence for particle j (cm2 MeV)−1, and K is a unit conversion factor (1.602×10⁻¹⁰) to convert dose to units of Gray (1 Gy = J/kg). Radiation health risk and the probability of biological damage depend not only on the absorbed dose but also on the particle type and energy of the radiation causing the dose. This is taken into account by weighting the tissue-averaged absorbed dose by a factor related to the quality of the radiation. The weighted tissue-averaged absorbed dose has been given the name equivalent dose by the ICRP [1991]. The unit of equivalent dose is the Sievert (Sv). Equivalent dose in tissue T from particle j, denoted Hj,T, is defined in terms of the radiation weighting factor wj, such that
| 24 |
where Dj,T denotes absorbed dose from particle j averaged over the tissue T. The radiation weighting factor is also a function of energy for neutrons [ICRP, 1991].
[54] The relationship between the probability of biological damage and equivalent dose depends also on the organ or tissue irradiated. The effective dose is an additional dosimetric quantity defined such that it includes the relative contributions of each organ or tissue to the total biological detriment caused by the radiation field. The effective dose, denoted E, is the sum of weighted equivalent dose in all the organs and tissues in the human body, such that
| 25 |
The origan and/or tissue weighting factors are listed in the ICRP 60 report [ICRP, 1991].
[55] All ICRP recommended radiation exposure limits are expressed in terms of effective dose. The effective dose is not a measurable quantity, however. The ICRP/ICRU recommended operational quantity for radiation protection applications is ambient dose equivalent [ICRP, 2007; ICRU, 2010], which is denoted as H∗(d) and defined as the dose equivalent that would be produced by the corresponding expanded and aligned field at a depth d in millimeters along the radius vector of a 300 mm diameter spherical tissue-equivalent phantom material opposing the direction of the aligned field. The ambient dose equivalent at a depth of 10 mm, H∗(10), is recommended and widely used as a reasonable operational proxy for effective dose.
[56] The ambient dose equivalent is defined in terms of dose equivalent, which is not quite the same as the equivalent dose in (26). Equivalent dose is defined as the tissue-averaged absorbed dose weight by a discrete radiation quality factor. Dose equivalent, on the other hand, is defined at a point x and is computed in terms of a continuous radiation quality factor. Specifically, the dose equivalent in tissue T from particle j (Hj,T(x)) is defined in terms of the tissue LET-dependent quality factor Q, such that
| 26 |
where L is LET (linear energy transfer), which can be approximated by the stopping power in units of keV/μm; Dj(x,L) is the LET-spectral dose distribution absorbed in tissue T from particle j, and Q(L) is the tissue LET-dependent quality factor [ICRP, 1991].
[57] It should be noted that ambient dose equivalent overestimates effective dose in most workplace radiation fields. However, ambient dose equivalent is not a conservative estimate for cosmic radiation exposure at aviation altitudes [Pelliccioni, 2000]. Nevertheless, it is still generally regarded as an acceptable approximation for effective dose at aircraft altitudes as well [Meier et al., 2009].
[58] Microdosimeters provide an “observation” of ambient dose equivalent by measuring the LET spectrum of absorbed dose in a tissue-equivalent material, followed by a conversion of the observed LET spectrum to H∗(10) using the radiation quality factor in (26) and calibration coefficients from laboratory comparisons against a known dose equivalent source [ICRU, 2010].
[59] The dosimetric quantities computed by the NAIRAS model are effective dose rate, ambient dose equivalent rate, and absorbed dose rate in silicon. The effective dose rate is the primary quantity provided to the NAIRAS stakeholders for radiation risk assessment and radiation exposure mitigation. The ambient dose equivalent rate (dH∗(10)/dt) is provided for direct comparison with microdosimeter measurements. Absorbed dose rate in silicon is also provided for direct comparison with semiconductor ionizing radiation detectors. NAIRAS model predictions of these dosimetric quantities are presented in section 3.
[60] The NAIRAS model calculates the dosimetric quantities from the particle spectral fluence rates. The effective dose rate and ambient dose equivalent rate are calculated using precomputed fluence-to-effective dose and fluence-to-ambient dose equivalent conversion coefficients, respectively. The NAIRAS model uses neutron and proton conversion coefficients tabulated by Ferrari et al. [1997a, 1997b]. The contributions to these dosimetric quantities from the other GCR and SEP ions are obtained by scaling the proton conversion coefficients by  , according to the stopping power dependence on charge and mass [Mertens et al., 2010, 2012]. The effective charge of particle j, i.e., Zj,eff, takes into account electron capture by heavy ions at low kinetic energies [Tai et al., 1997]. The absorbed dose rate in silicon is calculated at zero depth from (23) using the stopping power in silicon.
3. Results and Discussion
[61] NAIRAS predictions of GCR aircraft radiation exposure rates are presented and analyzed. In section 3.1, a climatology of dosimetric quantities representative of solar cycle maximum and solar cycle minimum conditions is developed. Monthly-mean dose rates computed from the NAIRAS model are compared to reference measurement data in section 3.2 for the three solar polar magnetic field polarity states discussed previously. NAIRAS model dose rates are also compared to onboard aircraft radiation measurements taken during the recent solar cycle minimum, which is discussed in section 3.3. A summary and overall assessment of the NAIRAS model validation is given in section 3.4.
3.1 Atmospheric Dose Rate Climatology
[62] Five decades of annual-averaged GCR atmospheric dosimetric quantities were computed from 1960 to 2010. In this case, neutron count rates from Izmiran and Thule were used to compute the solar modulation potential, since these are the only neutron monitor sites used by the H-BON10 GCR model that had continuous data coverage over this study period (see Figure 1). Figure 5 shows the annual-average solar modulation potential for this study. The hourly-average solar modulation potential is also shown to illustrate the short-term variability of the interplanetary medium. The annual-average solar modulation potential was used to select the years of solar maximum and solar minimum conditions over the 1960–2010 time period. The annual-average dosimetric quantities from 1960, 1969, 1982, 1991, and 2003 were averaged together to construct a climatology of dosimetric quantities representative of solar maximum conditions. The solar minimum climatology was constructed by averaging together the annual-average dosimetric quantities from 1965, 1977, 1987, 1997, and 2009.
Figure 5.
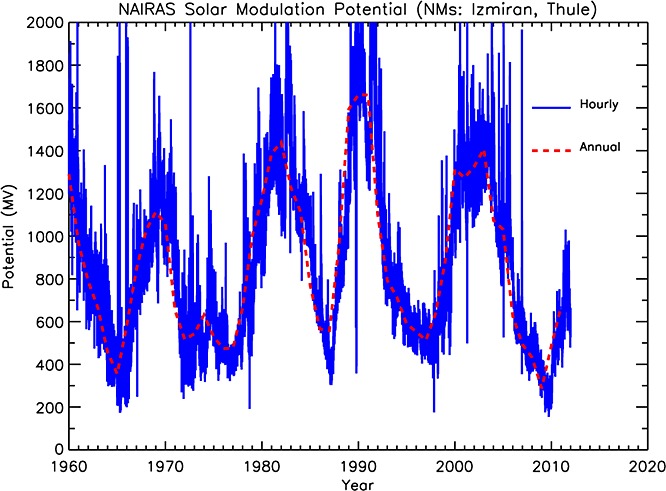
Hourly-average (blue line) and annual-average (red line) solar modulation potential (Φ(t)) determined by the H-BON10 model from Izmiran and Thule neutron monitor count rates.
[63] Figures 6 and 7 show the climatology of effective dose and ambient dose equivalent rates at representative geometric altitudes and flight levels for solar maximum and solar minimum conditions. The 2008 annual-average dosimetric quantities are also shown since this is the year of the onboard aircraft radiation measurements presented in section 3.3. The typical cruising altitude of long-haul commercial aircraft is 11 km. Private executive jets typically cruise at 15 km for long-haul flights. However, these altitudes are averages that vary with meteorological conditions, since jet aircraft actually cruise on constant pressure surfaces. To remove the meteorological variability, the effective dose and ambient dose equivalent rates are also shown in Figures 6 and 7 at various flight levels. The definition of flight level is such that FL350, for example, is the flight level at the pressure surface associated with 35,000 ft in the U.S. Standard Atmosphere. The dosimetric quantities are presented at the same flight levels reported in the tabulated reference measurement data described in the next section.
Figure 6.
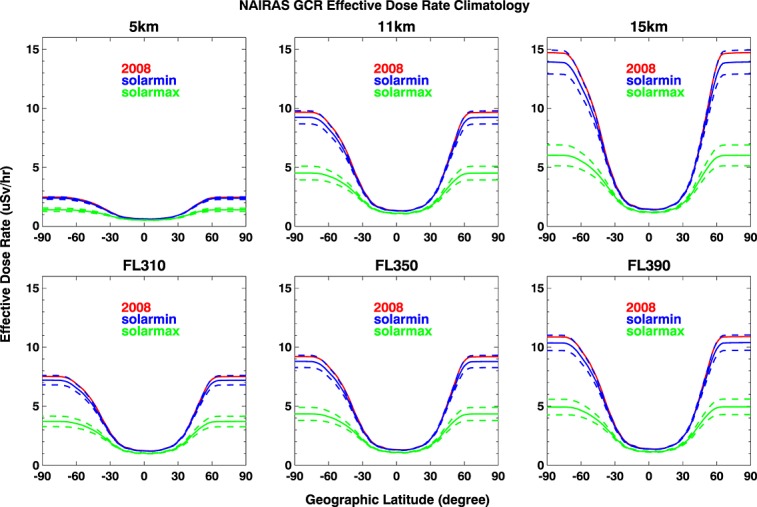
Climatology of zonal-average effective dose rates at various altitudes for solar minimum (solid blue line), solar maximum (solid green line), and annual average for year 2008 (solid red line). Dose rates for solar minimum are computed mean values of the annual averages for years 1965, 1977, 1987, 1997, and 2009. Dose rates for solar maximum are computed mean values of the annual averages for years 1960, 1969, 1982, 1991, and 2003. The dashed lines are the solar minimum/maximum (blue/green) averages plus and minus one standard deviation. Flight levels (altitudes denoted with prefix FL) are defined in the text.
Figure 7.
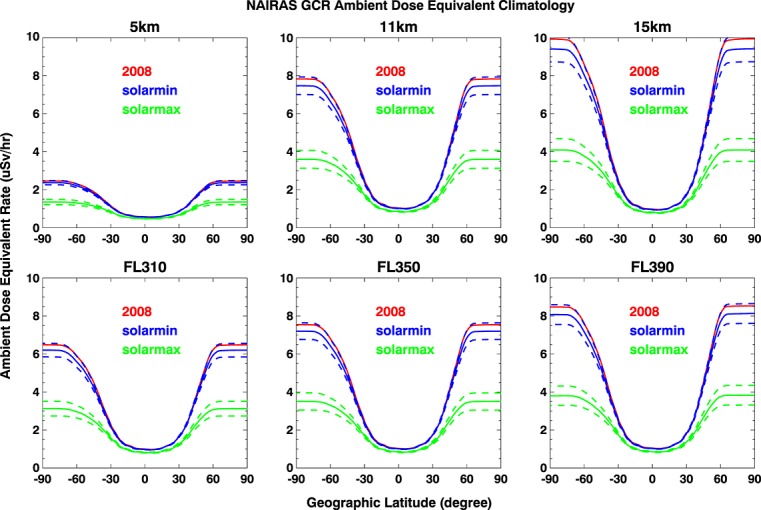
Climatology of zonal-average ambient dose equivalent rates at various altitudes for solar minimum (solid blue line), solar maximum (solid green line), and annual average for year 2008 (solid red line). Dose rates for solar minimum are computed mean values of the annual averages for years 1965, 1977, 1987, 1997, and 2009. Dose rates for solar maximum are computed mean values of the annual averages for years 1960, 1969, 1982, 1991, and 2003. The dashed lines are the solar minimum/maximum (blue/green) averages plus and minus one standard deviation. Flight levels (altitudes denoted with prefix FL) are defined in the text.
[64] The dose rates as a function of geographic latitude in Figures 6 and 7 were constructed by taking the zonal average of the global climatology of dosimetric quantities representative of solar maximum and solar minimum conditions at 2° latitude intervals. The dashed lines in these figures show the standard deviation about the zonal mean. The latitude variation in the zonal-average dosimetric quantities is the inverse of the latitude variation in the zonal-average vertical geomagnetic cutoff rigidities shown in Figure 4. Higher cutoff rigidities correspond to greater momentum shielding by the geomagnetic field and smaller dose rates in the atmosphere. Lower cutoff rigidities, on the other hand, correspond to lesser momentum shielding and larger atmospheric dose rates.
[65] As a result of the geomagnetic shielding effects discussed above, solar modulation of the atmospheric dosimetric quantities is maximum at the poles and minimum near the equator. The effective dose and ambient dose equivalent rates are both on the order of ∼1 μSv/h at the equator for the altitudes shown in Figures 6 and 7. For solar maximum, the effective dose rates at 11 km and 15 km in the polar region are 4.5 μSv/h and 6.0 μSv/h, respectively. The polar region effective dose rates are, respectively, 9.2 μSv/h and 13.2 μSv/h at the 11 km and 15 km altitudes for solar minimum conditions. For solar maximum and solar minimum, the ambient dose equivalent rates in the polar region at 11 km are 3.6 μSv/h and 7.5 μSv/h, respectively. At 15 km, the polar region ambient dose equivalent rates are 4.1 μSv/h and 9.4 μSv/h for solar maximum and solar minimum conditions, respectively.
[66] The geomagnetic shielding effects on the solar modulation of the atmospheric dosimetric quantities described above can be understood as follows. Spectral filtering of the incident GCR spectrum by the geomagnetic field at the equator excludes all but the high-energy cosmic rays from gaining access to the neutral atmosphere. From Figure 4, for example, only protons with energies greater than ∼15 GeV can penetrate the geomagnetic field and gain access to the neutral atmosphere. The high-energy GCR particles are minimally modulated by the interplanetary medium, as evident from Figures 6 and 7. For example, there is less than a 20% difference in the dosimetric quantities between solar minimum and solar maximum conditions at the equator. However, the representative solar minimum and solar maximum dosimetric quantities differ by about a factor of 2 in the polar regions. In the polar regions there is virtually no momentum shielding by the geomagnetic field, which maximizes the variation in the atmospheric dosimetric quantities due to the modulation of the heliospheric GCR spectrum by the interplanetary medium. At 30° latitude (north or south), the dosimetric quantities for solar minimum are about 30% greater than the dosimetric quantities at solar maximum.
[67] The dose rate climatology is shown in Figures 8 and 9 as a function vertical geomagnetic cutoff rigidity. In this representation, the global grid of effective dose and ambient dose equivalent rates for solar maximum and solar minimum conditions were averaged in intervals of 1 GV in vertical geomagnetic cutoff rigidity. This representation of the dose rate climatology provides useful reference data for documenting the full range of NAIRAS GCR predictions at typical commercial aircraft altitudes, as well as provides a useful dataset for benchmarking NAIRAS results against other models and measurements.
Figure 8.
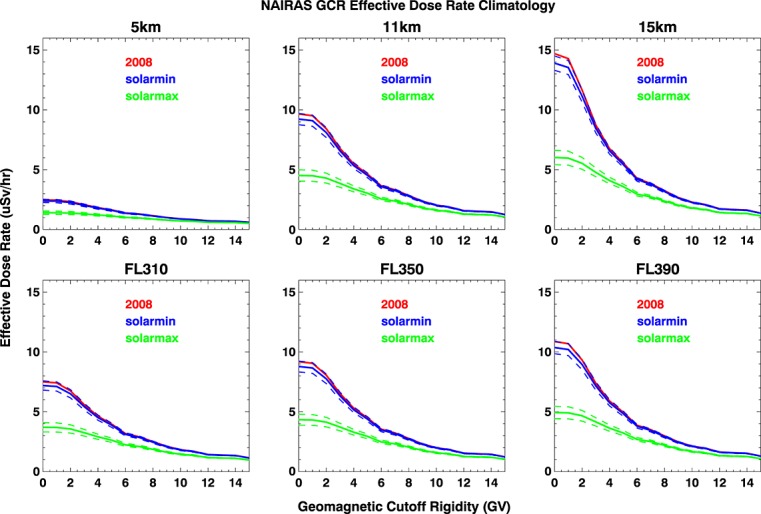
Climatology of effective dose rates as a function of vertical geomagnetic cutoff rigidity at various altitudes for solar minimum (solid blue line), solar maximum (solid green line), and annual average for year 2008 (solid red line). Dose rates for solar minimum are computed mean values of the annual averages for years 1965, 1977, 1987, 1997, and 2009. Dose rates for solar maximum are computed mean values of the annual averages for years 1960, 1969, 1982, 1991, and 2003. The dashed lines are the solar minimum/maximum (blue/green) averages plus and minus one standard deviation. Flight levels (altitudes denoted with prefix FL) are defined in the text.
Figure 9.
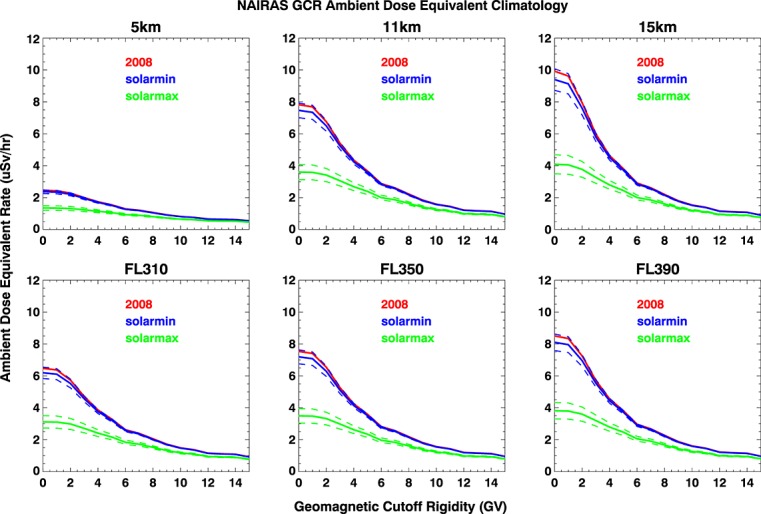
Climatology of ambient dose equivalent rates as a function of vertical geomagnetic cutoff rigidity at various altitudes for solar minimum (solid blue line), solar maximum (solid green line), and annual average for year 2008 (solid red line). Dose rates for solar minimum are computed mean values of the annual averages for years 1965, 1977, 1987, 1997, and 2009. Dose rates for solar maximum are computed mean values of the annual averages for years 1960, 1969, 1982, 1991, and 2003. The dashed lines are the solar minimum/maximum (blue/green) averages plus and minus one standard deviation. Flight levels (altitudes denoted with prefix FL) are defined in the text.
3.2 Reference Aircraft Radiation Measurements
[68] Figure 0 shows NAIRAS model monthly-average ambient dose equivalent rates at three flight levels as a function of vertical geomagnetic cutoff rigidity for January 1998, January 2000, and January 2002. These results are compared to corresponding reference measurement data tabulated in the joint report of the International Commission on Radiation Units and Measurements (ICRU) and ICRP [ICRU, 2010]. The reference data were constructed from onboard aircraft measurements of ambient dose equivalent rate over the period from 1992 to 2006, which covered most of the range of solar activity, the most common commercial aircraft cruising altitudes, and the full range of vertical geomagnetic cutoff rigidities. These measurements, which included a variety of instrument types and calibration methods, have been fitted with a simple function using a Bayesian approach. The fitted model equation was used to determine the reference measurement data for January 1998, January 2000, and January 2002 at flight levels FL310, FL350, and FL390 and for vertical geomagnetic cutoff rigidities from 0 GV to 17 GV, as shown in Figure 0. The dates of the reference data correspond to three distinct characteristics of solar cycle activity. As evident from Figures 2 and 5, the year 1998 corresponds to solar minimum and solar polar magnetic field positive polarity state. The year 2000 is in the transitional polarity state, while 2002 corresponds to solar maximum and negative solar polar magnetic field polarity.
Figure 10.
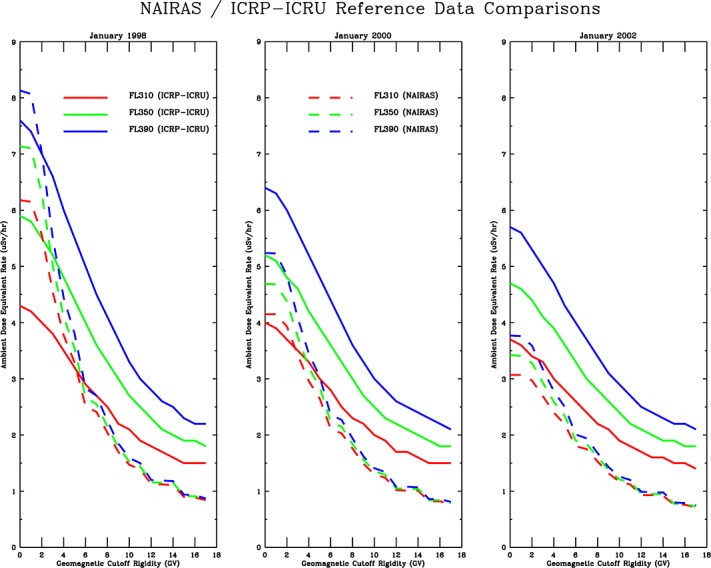
NAIRAS model comparisons with ICRU reference ambient dose equivalent rate versus vertical geomagnetic cutoff rigidity for different solar activity characteristics. The comparisons for (left) January 1998 (solar minimum, positive polarity), (middle) January 2000 (transitional state), and (right) January 2002 (solar maximum, negative polarity). Each panel shows the ambient dose equivalent rate versus cutoff at flight levels FL310, FL250, and FL390.
[69] The qualitative features of the NAIRAS/ICRU comparisons in Figure 10 are as follows. The NAIRAS ambient dose equivalent rates systematically underestimate the ICRU reference values for vertical geomagnetic cutoff rigidities greater than 6 GV. The NAIRAS model shows a more rapid decrease in the dose rates with time in going from 1998 to 2002. The NAIRAS dose rates are larger than the ICRU values at low cutoff rigidities in 1998 (solar maximum/positive polarity) but lower than the ICRU values at low cutoffs in 2002 (solar minimum/negative polarity). The NAIRAS dose rates have a steeper slope with respect to cutoff rigidities in the region between low and high cutoff values. The NAIRAS model shows a smaller change in dose rate between the three flight levels, especially at middle- to high-cutoff rigidities.
[70] Quantitative comparisons between the NAIRAS/ICRU ambient dose equivalent rates shown in Figure 0 are provided in Tables 4. The differences are largely within ± 50% for the three flight levels, the full range of cutoff rigidities, and solar activity characteristics. NAIRAS underestimates the ICRU dose rates by about 60% for the highest cutoff rigidities at FL390. Despite a few exceptions, it is interesting to note that the NAIRAS/ICRU dose rate differences for cutoff rigidities between 0 and 4 GV are usually within ± 25%. This range of cutoff rigidity corresponds to latitudes poleward of about 30°. In the equatorial region, the dose rates are quite low. Therefore, the dose rate differences are generally within ± 25% except in the subtropical and equator regions where the radiation exposure is at its minimum. The relevance of this point will be revisited in section 3.4.
Table 4.
NAIRAS/ICRU Reference Ambient Dose Equivalent Rate (μSv/h) Comparisons as a Function of Geomagnetic Vertical Cutoff Rigidity (Rvc) for January 2002 (Solar Maximum) at Three Flight Levels (FL)
| FL310 | FL350 | FL390 | |||||||
|---|---|---|---|---|---|---|---|---|---|
| Rvc(GV) | NAIRAS | Diff(%) | NAIRAS | Diff(%) | NAIRAS | Diff(%) | |||
| 0 | 3.1 | −17.0 | 3.4 | −27.2 | 3.8 | −33.9 | |||
| 1 | 3.1 | −14.7 | 3.4 | −25.9 | 3.8 | −32.9 | |||
| 2 | 3.0 | −12.6 | 3.3 | −25.4 | 3.6 | −32.3 | |||
| 3 | 2.7 | −18.5 | 2.9 | −28.5 | 3.2 | −36.6 | |||
| 4 | 2.4 | −20.0 | 2.6 | −33.6 | 2.8 | −40.8 | |||
| 5 | 2.2 | −21.8 | 2.3 | −35.0 | 2.5 | −41.9 | |||
| 6 | 1.8 | −30.8 | 1.9 | −42.4 | 2.0 | −49.8 | |||
| 7 | 1.8 | −27.1 | 1.8 | −38.7 | 1.9 | −47.6 | |||
| 8 | 1.5 | −30.4 | 1.6 | −42.5 | 1.7 | −50.6 | |||
| 9 | 1.3 | −37.1 | 1.4 | −46.9 | 1.4 | −53.9 | |||
| 10 | 1.2 | −38.4 | 1.2 | −49.6 | 1.3 | −56.6 | |||
| 11 | 1.1 | −37.8 | 1.2 | −47.3 | 1.2 | −55.6 | |||
| 12 | 0.9 | −45.3 | 1.0 | −54.3 | 1.0 | −60.4 | |||
| 13 | 0.9 | −41.9 | 1.0 | −52.5 | 1.0 | −59.2 | |||
| 14 | 0.9 | −42.5 | 1.0 | −50.0 | 1.0 | −57.4 | |||
| 15 | 0.8 | −49.3 | 0.8 | −59.0 | 0.8 | −63.6 | |||
| 16 | 0.8 | −49.3 | 0.8 | −57.2 | 0.8 | −64.1 | |||
| 17 | 0.7 | −49.3 | 0.7 | −59.4 | 0.8 | −64.3 | |||
Table 3.
NAIRAS/ICRU Reference Ambient Dose Equivalent Rate (μSv/h) Comparisons as a Function of Geomagnetic Vertical Cutoff Rigidity (Rvc) for January 2000 (Solar Transition) at Three Flight Levels (FL)
| FL310 | FL350 | FL390 | |||||||
|---|---|---|---|---|---|---|---|---|---|
| Rvc(GV) | NAIRAS | Diff(%) | NAIRAS | Diff(%) | NAIRAS | Diff(%) | |||
| 0 | 4.2 | 3.8 | 4.7 | −9.8 | 5.2 | −18.1 | |||
| 1 | 4.2 | 6.4 | 4.7 | −8.2 | 5.2 | −17.0 | |||
| 2 | 3.9 | 6.2 | 4.4 | −8.8 | 4.8 | −19.3 | |||
| 3 | 3.4 | −2.3 | 3.7 | −18.7 | 4.1 | −27.1 | |||
| 4 | 3.0 | −10.3 | 3.2 | −23.8 | 3.4 | −33.6 | |||
| 5 | 2.7 | −11.7 | 2.8 | −26.9 | 3.0 | −36.7 | |||
| 6 | 2.1 | −24.6 | 2.2 | −38.1 | 2.4 | −46.4 | |||
| 7 | 2.0 | −18.8 | 2.2 | −34.8 | 2.3 | −43.2 | |||
| 8 | 1.8 | −23.5 | 1.8 | −38.7 | 1.9 | −46.1 | |||
| 9 | 1.5 | −32.3 | 1.6 | −42.2 | 1.6 | −50.9 | |||
| 10 | 1.3 | −35.0 | 1.4 | −45.6 | 1.4 | −53.0 | |||
| 11 | 1.2 | −34.7 | 1.3 | −43.9 | 1.3 | −52.1 | |||
| 12 | 1.0 | −40.0 | 1.0 | −52.3 | 1.1 | −58.5 | |||
| 13 | 1.0 | −40.6 | 1.0 | −50.5 | 1.1 | −56.8 | |||
| 14 | 1.0 | −36.9 | 1.0 | −48.0 | 1.1 | −55.4 | |||
| 15 | 0.8 | −45.3 | 0.8 | −55.8 | 0.9 | −62.6 | |||
| 16 | 0.8 | −45.3 | 0.8 | −53.3 | 0.9 | −60.9 | |||
| 17 | 0.8 | −48.7 | 0.8 | −56.1 | 0.8 | −61.4 | |||
[71] The dose rate variation with altitude can be quantitatively compared using Tables 4. As an example, consider Table 2 the January 1998 solar cycle minimum case. The slope of ambient dose equivalent rate versus flight level at zero cutoff rigidity over the range FL310 to FL390 is 0.0412 μSv/(h 100 ft) for the ICRU reference data. The dose rate slope given by the NAIRAS model for the same conditions is 0.0238 μSv/(h 100 ft). Thus, the dose rates of the ICRU data in the polar region are increasing with altitude by a factor of 2 greater than the NAIRAS dose rates. The differences in altitude variation of dose between NAIRAS and ICRU data are even greater in the equatorial region where the geomagnetic cutoff rigidity is high. At 13 GV cutoff, for example, the ICRU slope of ambient dose equivalent rate versus flight level is 0.0112 μSv/(h 100 ft), while the corresponding slope from the NAIRAS model is 0.0013 μSv/(h 100 ft). It is noted that the dose rate variations with respect to altitude from the aircraft radiation measurements taken in 2006–2008 during solar cycle minimum are consistent with the ICRU reference data [Meier et al., 2009].
Table 2.
NAIRAS/ICRU Reference Ambient Dose Equivalent Rate(μSv/h) Comparisons as a Function of Geomagnetic Vertical Cutoff Rigidity (Rvc) for January 1998 (Solar Minimum) at Three Flight Levels (FL)
| FL310 | FL350 | FL390 | |||||||
|---|---|---|---|---|---|---|---|---|---|
| Rvc(GV) | NAIRAS | Diff(%) | NAIRAS | Diff(%) | NAIRAS | Diff(%) | |||
| 0 | 6.2 | 43.7 | 7.1 | 21.0 | 8.1 | 7.0 | |||
| 1 | 6.2 | 46.4 | 7.1 | 22.4 | 8.1 | 9.1 | |||
| 2 | 5.6 | 39.0 | 6.3 | 14.4 | 7.0 | 0.3 | |||
| 3 | 4.5 | 19.5 | 5.0 | −3.6 | 5.5 | −16.7 | |||
| 4 | 3.8 | 7.7 | 4.1 | −14.6 | 4.4 | −26.0 | |||
| 5 | 3.3 | 2.8 | 3.5 | −19.6 | 3.8 | −30.9 | |||
| 6 | 2.5 | −13.4 | 2.7 | −33.2 | 2.8 | −43.4 | |||
| 7 | 2.4 | −10.7 | 2.6 | −29.2 | 2.7 | −40.0 | |||
| 8 | 2.0 | −18.4 | 2.2 | −34.8 | 2.2 | −45.1 | |||
| 9 | 1.7 | −22.7 | 1.8 | −40.7 | 1.8 | −50.0 | |||
| 10 | 1.5 | −30.0 | 1.5 | −43.3 | 1.6 | −51.8 | |||
| 11 | 1.4 | −26.8 | 1.4 | −42.4 | 1.5 | −50.0 | |||
| 12 | 1.1 | −37.2 | 1.2 | −49.6 | 1.2 | −57.1 | |||
| 13 | 1.1 | −34.1 | 1.2 | −45.2 | 1.2 | −54.2 | |||
| 14 | 1.1 | −30.6 | 1.2 | −42.5 | 0.9 | −52.8 | |||
| 15 | 0.9 | −40.0 | 0.9 | −51.6 | 0.9 | −59.1 | |||
| 16 | 0.9 | −40.7 | 0.9 | −52.8 | 0.9 | −57.7 | |||
| 17 | 0.8 | −44.0 | 0.9 | −52.8 | 0.9 | −60.4 | |||
[72] Off-line numerical simulations suggest that the underprediction of NAIRAS dosimetric quantities at high cutoff rigidities is partly due to π/EM electromagnetic cascade processes that are currently not included in the HZETRN 2010 version. The π/EM processes can also partially explain the smaller variation in NAIRAS dose rates versus flight level relative to the ICRU reference data. This is discussed in more detail in the next section.
[73] Figures 1 and 2 show the NAIRAS profiles of effective dose and ambient dose equivalent rates for the vertical geomagnetic cutoff rigidities and solar activity characteristics corresponding to Figure 0. The horizontal lines indicate the three flight levels in Figure 0 on the U.S. Standard Atmosphere altitude grid. Although these three flight levels cover the range of cruising altitudes for typical commercial aircraft, it is clear from these figures that measurements over a broader altitude range are required to provide a comprehensive assessment of the model performance, since the particle composition and spectral flux of the ionizing radiation field varies as a function of atmospheric depth (see Figures 2 and 3).
Figure 11.
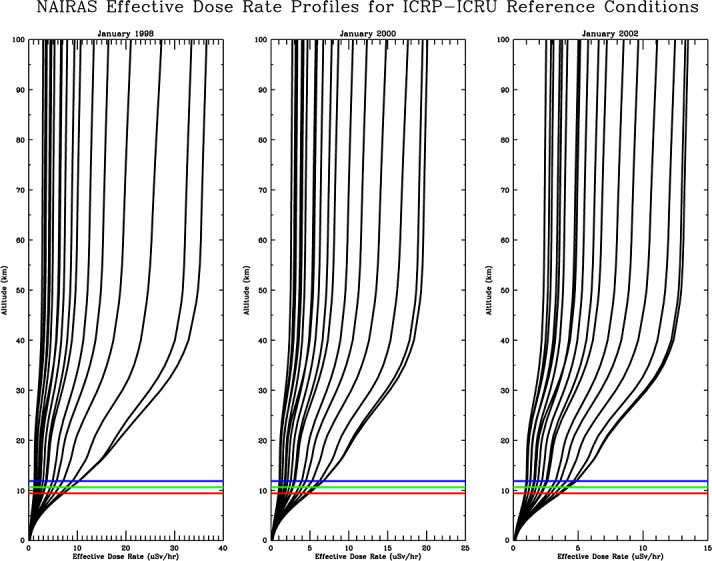
Profiles of NAIRAS model effective dose rates for different solar activity characteristics. Dose rates for (left) January 1998 (solar minimum, positive polarity), (middle) January 2000 (transitional state), and (right) January 2002 (solar maximum, negative polarity). Each panel has profiles of effective dose rates at vertical geomagnetic cutoff rigidities from 0 to 17GV in increments of 1GV. The profiles will be ordered from left to right in each panel from largest to smallest cutoff rigidity.
Figure 12.
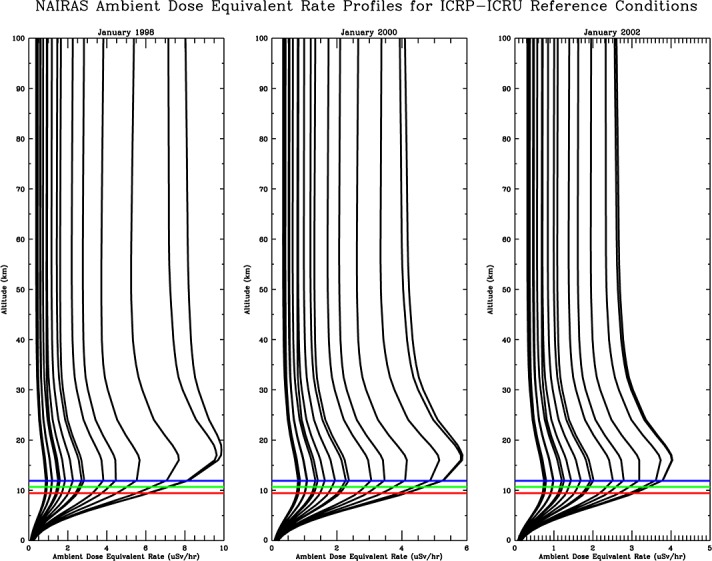
Profiles of NAIRAS model ambient dose equivalent rates for different solar activity characteristics. The dose rates for (left) January 1998 (solar minimum, positive polarity), (middle) January 2000 (transitional state), and (right) January 2002 (solar maximum, negative polarity). Each panel has profiles of ambient dose equivalent rates at vertical geomagnetic cutoff rigidities from 0 to 17 GV in increments of 1 GV. The profiles will be ordered from left to right in each panel from largest to smallest cutoff rigidity.
3.3 Aircraft Radiation Measurements in 2008
[74] In this section NAIRAS model predictions are compared with onboard aircraft radiation measurements obtained in 2008 during solar minimum conditions. The measurement data were taken and analyzed by the German Aerospace Center (DLR) on an equatorial flight and a high-latitude flight [Hubiak, 2008]. The equatorial flight was from Dusseldorf, Germany to the island nation of Mauritius (DUS-MRU) on 13–14 February 2008. The high-latitude flight was from Fairbanks, Alaska to Frankfort, Germany (FAI-FRA) on 23 May 2008.
[75] The radiation measurements collected during the DLR flights were taken from two instruments: a Hawk version 2.0 Tissue Equivalent Proportional Counter (TEPC) and a Liulin-6G MDU (Mobile Dosimetry Unit) semiconductor detector. The “Hawk” TEPC was built by Far West Technology, Inc., and is specifically designed to be used onboard aircraft [Meier et al., 2009]. The Hawk measures the ambient dose equivalent rate based on a microdosimetric spectral analysis of the ionizing radiation field [ISO, 2010]. It is powered by four D-cell batteries and packaged in a carry-on luggage size suitcase, which can be easily stowed in the aircraft cabin. The sensitive volume of the TEPC is a spherical cavity with an inner diameter of 4.95 inches, which is surrounded by the tissue-equivalent plastic A-150 and filled with propane gas at a reduced pressure of 7 Torr in order to emulate a tissue volume with a diameter of 2 μm [Walker, 1995; Gersey et al., 2002, 2007; Chang and Kim, 2008; Lindborg and Nikjoo, 2011]. The cavity is housed in a vacuum-sealed stainless steel container, whereas the spectrum analyzer electronics are arranged in an aluminum cylinder attached directly to the stainless steel detector base. The unit has a display which shows useful information for monitoring the data acquisition process—e.g., time, date, total accumulated dose, dose rate, etc.
[76] The Liulin-6G MDU was manufactured at the Solar-Terrestrial Influences Laboratory of the Bulgarian Academy of Sciences in Sofia. The Liulin MDU was originally developed for and successfully tested onboard aircraft [Dachev, 2009]. It is designed as a hand-held device and consists of a silicon diode (2.31 cm2, thickness 300 μm), a charge-sensitive preamplifier (A225 by AMPTEK), a discriminator, a 12 bit analog-to-digital converter (ADC), two microcontrollers, a flash memory (2.0 MB), LCD display, and Li-ion cells (3.6 V, 1.8 Ah, LR1865PC type). Pulse height analysis technique is used to measure the energy deposition of charged particles in the detector. The amplitude of the pulses after the preamplifier processing is proportional to the energy loss. These amplitudes are digitized by the ADC and arranged in a 256-channel spectrum. The total energy loss in the detector is proportional to the channel-number-weighted sum of the number of counts in each channel. The absorbed dose rate is determined by dividing the total energy loss in the detector by the data collection time and multiplying this quantity by a constant that includes calibration and unit conversion factors [Stassinopoulos et al., 2002].
[77] The hourly-average and annual-average solar modulation potentials are shown in Figure 3 for 2008. This figure provides a simple representation of the dynamical state of the interplanetary medium during the two DLR flights. The solar modulation potential during the DUS-MRU flight has a noticeable variation over the duration of this flight. However, since most of this flight is at low latitudes and, thus, high geomagnetic cutoff rigidities, the time variations in the interplanetary medium will not likely map into large temporal variations in the atmospheric dose rates. As a result, any discrepancies between the NAIRAS model predictions and the flight measurements will not likely be attributed to uncertainties in the dynamical response of the H-BON10 GCR model. Furthermore, Figure 3 indicates that the solar modulation potential does not vary substantially during the FAI-FRA flight. Therefore, model/measurement discrepancies during the DLR flights are not likely attributed to the dynamical response of the H-BON10 model.
Figure 13.
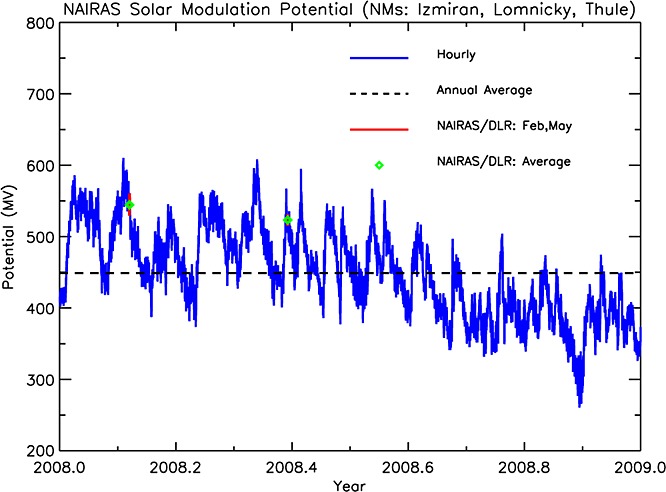
Hourly-average (blue line) and annual-average (dashed black line) solar modulation potential (Φ(t)) for year 2008. The red lines identify Φ(t) during the time period of onboard flight measurements taken by DLR on 13–14 February 2008 and 23 May 2008. The green diamonds denote the average Φ(t) over these time periods of the DLR flight measurements.
[78] The measurement and model data during the low-latitude DUS-MRU flight are presented in Figures 4 and 5. Figure 4 shows the 1 min TEPC/Liulin flight data as a function of elapsed time. The large variations in the 1 min TEPC data are due to isolated high-LET events [Meier et al.]. The figure also shows that the aircraft cruised at three flight levels: FL350, FL370, and FL410. Figure 5 provides a global context for the atmospheric ionizing radiation field by displaying NAIRAS hourly-average effective dose and ambient dose equivalent rates. The NAIRAS dosimetric quantities are shown at a time when the aircraft was cruising at the indicated flight levels. The DUS-MRU flight path is overlayed on each panel in Figure 5. Most of the DUS-MRU flight is at low latitudes and high geomagnetic cutoff rigidities that correspond to very low dose rates.
Figure 14.
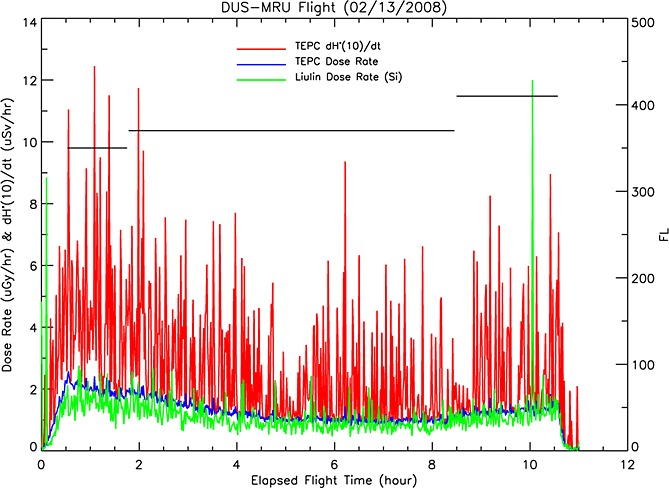
TEPC and Liulin dosimetric measurements on a flight from Dusseldorf, Germany (DUS) to Mauritius (MRU) on 13–14 February 2008. The left ordinate axis indicates dose rates versus elapsed time of flight (abscissa). The dose rate measurements shown are 1 min averages. The TEPC data shown are (blue line) absorbed dose rate in tissue (μGy/h) and (red line) ambient dose equivalent rate (μSv/h). The Liulin data are (green line) absorbed dose rate in silicon (μGy/h). The right ordinate axis indicates flight level versus elapsed time of flight (abscissa). Note: A correction to the calibration of the Liulin data has produced slightly lower dose rates than shown by Mertens et al. [2012].
Figure 15.
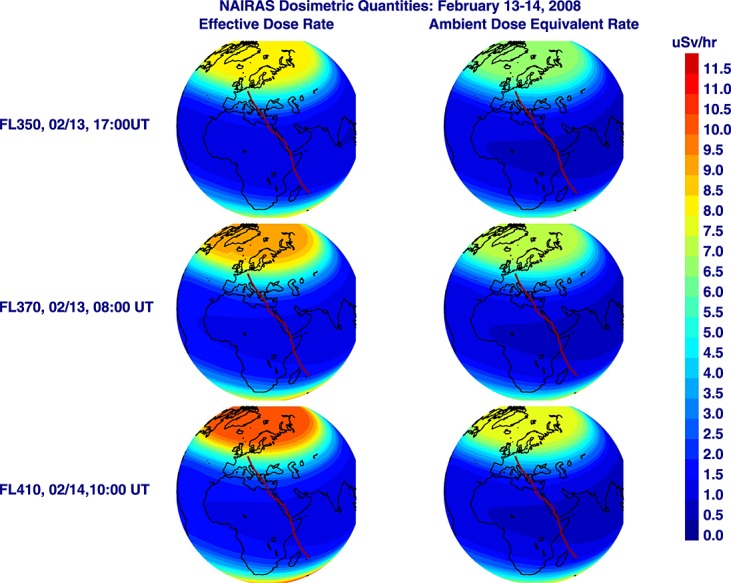
Effective and ambient dose equivalent rates computed on 13–14 February 2008. The rows show the dose rates at different flight levels (FL), dates, and times during the DLR flight measurements for the Dusseldorf, Germany (DUS) to Mauritius (MRU) flight. The DUS-MRU flight path is overlayed on each dose rate image as a solid red line.
[79] The DUS-MRU 1 min TEPC measurements were averaged over roughly 1 h intervals and compared with NAIRAS hourly-average predictions. These results are shown in Figure 6. The NAIRAS ambient dose equivalent rates are systematically biased low relative to the TEPC data. Quantitative NAIRAS/TEPC comparisons are given in Table 5 for the DUS-MRU flight. For a geomagnetic cutoff rigidity of ∼5 GV, the NAIRAS ambient dose equivalent rate underestimates the TEPC measurement by ∼25%. For the larger cutoff rigidities, NAIRAS underestimates the TEPC measurement by ∼50%. These differences are consistent with the NAIRAS/ICRU comparisons presented in the previous section.
Table 5.
NAIRAS/TEPC Ambient Dose Equivalent Rate Comparisons for the Dusseldorf, Germany to Mauritius (DUS-MRU) Flight on 13–14 February 2008
| Elapsed Time | Rvc | FL | NAIRAS | TEPC | Difference |
|---|---|---|---|---|---|
| (h) | (GV) | (ft/100) | (μSv/h) | (μSv/h) | (%) |
| 1.0 | 4.8 | 350 | 3.5 | 4.7 | −25.4 |
| 2.0 | 7.2 | 370 | 2.5 | 4.3 | −42.8 |
| 2.6 | 9.3 | 370 | 1.7 | 3.2 | −46.5 |
| 3.5 | 12.3 | 370 | 1.2 | 2.9 | −59.5 |
| 5.0 | 15.0 | 370 | 0.9 | 2.0 | −53.0 |
| 7.0 | 16.0 | 370 | 0.9 | 2.0 | −53.0 |
| 9.5 | 13.3 | 410 | 1.2 | 2.4 | −52.5 |
Figure 16.
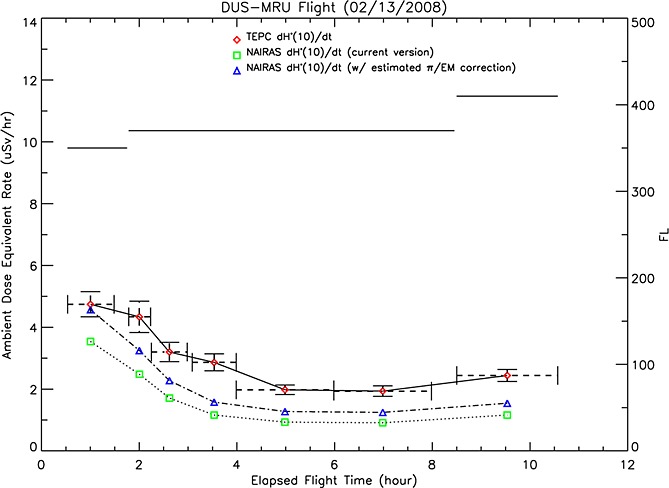
TEPC/NAIRAS comparisons of ambient dose equivalent rate for the flight from Dusseldorf, Germany (DUS) to Mauritius (MRU) on 13–14 February 2008. The left ordinate axis indicates ambient dose equivalent rate versus elapsed time of flight (abscissa). The TEPC measurements are shown as red diamonds. The NAIRAS predictions are shown as green squares. The blue triangles are estimated corrections to the NAIRAS results due to pion-initiated electromagnetic cascade processes. The 1 min TEPC data shown in Figure 4 have been averaged over roughly 1 h periods, which is shown in this figure. The horizontal errors bars in the above figure correspond to the averaging interval. The vertical error bars represent the standard error in the TEPC data.
[80] Figures 17 and 18 show the measurement and model dose rates during the high-latitude FAI-FRA flight. The 1 min TEPC/Liulin data are presented in Figure 17 as a function of elapsed time. The cruising altitudes for this flight were FL330, FL350, and FL370. The global context for the effective dose and ambient dose equivalent rates are shown in Figure 8 for a representative hour when the aircraft was cruising at the indicated flight levels. The FAI-FRA flight trajectory is overlayed in each panel, which shows a high-latitude flight (maximum geographic latitude ∼77°N, maximum geomagnetic latitude ∼87°N) at very low geomagnetic cutoff rigidities.
Figure 17.
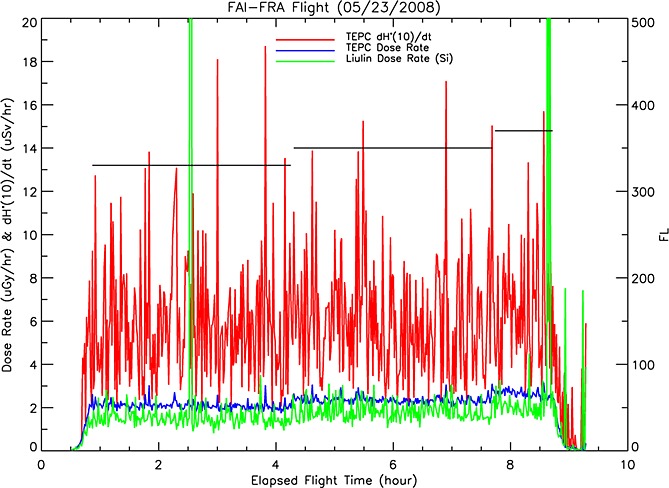
TEPC and Liulin dosimetric measurements on a flight from Fairbanks, Alaska (FAI) to Frankfurt, Germany (FRA) on 23 May 2008. The left ordinate axis indicates dose rates versus elapsed time of flight (abscissa). The dose rate measurements shown are 1 min averages. The TEPC data shown are (blue line) absorbed dose rate in tissue (μGy/h) and (red line) ambient dose equivalent rate (μSv/h). The Liulin data are (green line) absorbed dose rate in silicon (μGy/h). The right ordinate axis indicates flight level versus elapsed time of flight (abscissa). Note: A correction to the calibration of the Liulin data has produced slightly lower dose rates than shown by Mertens et al. [2012].
Figure 18.
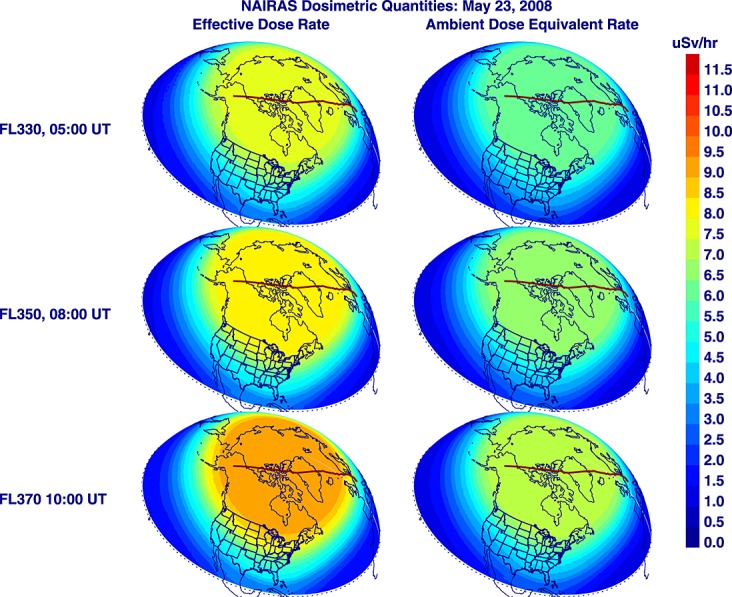
Effective and ambient dose equivalent rates computed on 23 May 2008. The rows show the dose rates at different flight levels (FL), dates, and times during the DLR flight measurements for the Fairbanks, Alaska (FAI) to Frankfurt, Germany (FRA) flight. The FAI-FRA flight path is overlayed on each dose rate image as a solid red line.
[81] The FAI-FRA NAIRAS/TEPC ambient dose equivalent rate comparisons are presented in Figure 9. Similar to the analysis of the previous flight, the 1 min TEPC data were averaged over approximately 1 h intervals to correspond to the NAIRAS model 1 h time cadence. For the FAI-FRA flight, the NAIRAS ambient dose equivalent rates are largely within the standard error of the mean of the hourly-average TEPC measurements. There is a slight overprediction by the NAIRAS model relative to the TEPC measurements. However, the NAIRAS/TEPC differences are significantly lower compared to the DUS-MRU flight. The quantitative comparisons for the FAI-FRA flight are given in Table 6. NAIRAS predictions of ambient dose equivalent rate are mostly within 10% and no more than 25%. Moreover, these comparisons are largely consistent with the NAIRAS/ICRU comparisons presented in the previous section.
Table 6.
NAIRAS/TEPC Ambient Dose Equivalent Rate Comparisons for the Fairbanks, Alaska to Frankfurt, Germany (FAI-FRA) Flight on 23 May 2008
| Elapsed Time | Rvc | FL | NAIRAS | TEPC | Difference |
|---|---|---|---|---|---|
| (h) | (GV) | (ft/100) | (μSv/h) | (μSv/h) | (%) |
| 1.5 | 0.1 | 330 | 6.3 | 5.6 | 12.4 |
| 2.6 | 0.0 | 330 | 6.4 | 6.5 | −1.6 |
| 3.7 | 0.0 | 330 | 6.4 | 5.8 | 9.9 |
| 5.5 | 0.1 | 350 | 6.8 | 6.4 | 6.0 |
| 6.6 | 0.4 | 350 | 6.8 | 5.5 | 24.7 |
| 7.4 | 1.0 | 350 | 6.8 | 6.2 | 9.5 |
| 8.2 | 1.9 | 370 | 6.5 | 6.3 | 3.1 |
Figure 19.
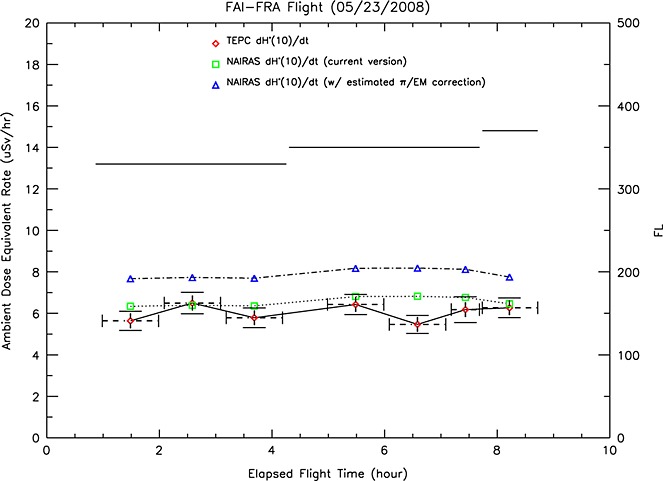
TEPC/NAIRAS comparisons of ambient dose equivalent rate for the flight from Fairbanks, Alaska (FAI) to Frankfurt, Germany (FRA) on 23 May 2008. The left ordinate axis indicates ambient dose equivalent rate versus elapsed time of flight (abscissa). The TEPC measurements are shown as red diamonds. The NAIRAS predictions are shown as green squares. The blue triangles are estimated corrections to the NAIRAS results due to pion-initiated electromagnetic cascade processes. The 1 min TEPC data shown in Figure 7 have been averaged over roughly 1 h periods, which is shown in this figure. The horizontal errors bars in the above figure correspond to the averaging interval. The vertical error bars represent the standard error in the TEPC data.
[82] Figures 20 and 21 show comparisons between Liulin measurements of absorbed dose rates and NAIRAS predictions of absorbed dose rates in silicon for the DUS-MRU and FAI-FRA DLR flights, respectively. The 1 min Liulin measurements in Figures 4 and 7 were averaged over roughly 1 h intervals and compared to the hourly-average NAIRAS predictions. The NAIRAS/Liulin differences are generally 15–30% greater than the corresponding NAIRAS/TEPC differences. Absorbed dose in a thin silicon detector, such as the Liulin instrument, is largely insensitive to neutrons. On the other hand, neutrons dominate the contributions to effective dose and ambient dose equivalent at commercial airline altitudes, due to the combined effect of a large radiation quality factor at low energy [ICRP, 1991], Q(L) in (26), and correspondingly large low-energy neutron flux in the atmosphere [ICRP, 1991; Wilson et al., 1991; Mertens et al., 2012]. Thus, the NAIRAS/TEPC and NAIRAS/Liulin comparisons suggest the NAIRAS model has larger errors in the atmospheric charged particle transport procedure compared to the neutron transport code.
Figure 20.
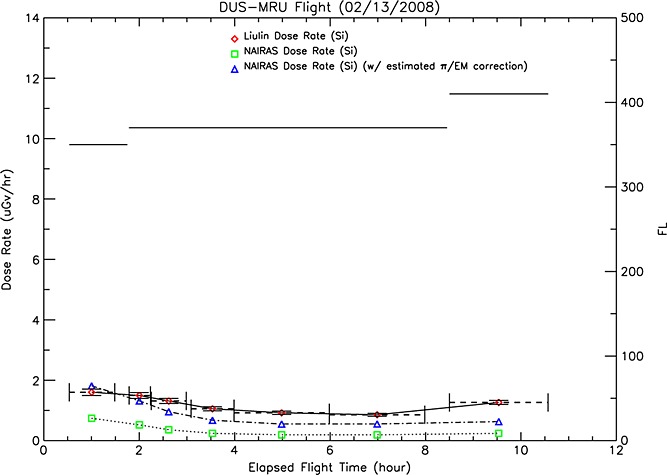
Liulin/NAIRAS comparisons of absorbed dose rate in silicon for the flight from Dusseldorf, Germany (DUS) to Mauritius (MRU) on 13–14 February 2008. The left ordinate axis indicates absorbed dose rate in silicon versus elapsed time of flight (abscissa). The Liulin measurements are shown as red diamonds. The NAIRAS predictions are shown as green squares. The blue triangles are estimated corrections to the NAIRAS results due to pion-initiated electromagnetic cascade processes. The 1 min Liulin data shown in Figure 4 have been averaged over roughly 1 h periods, which is shown in this figure. The horizontal errors bars in the above figure correspond to the averaging interval. The vertical error bars represent the standard error in the Liulin data.
Figure 21.
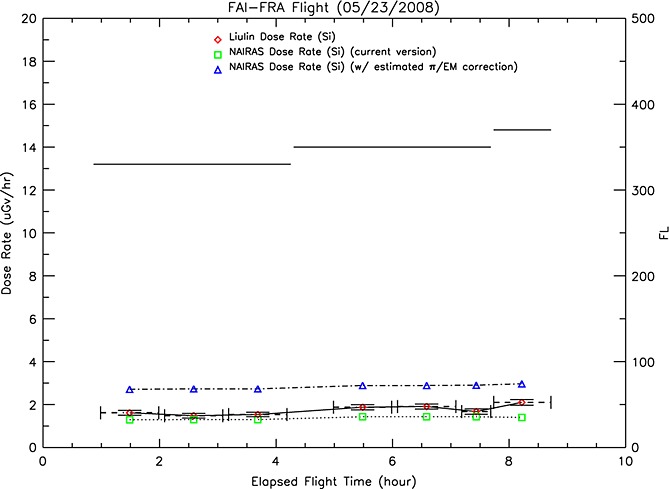
Liulin/NAIRAS comparisons of absorbed dose rate in silicon for the flight from Fairbanks, Alaska (FAI) to Frankfurt, Germany (FRA) on 23 May 2008. The left ordinate axis indicates absorbed dose rate in silicon versus elapsed time of flight (abscissa). The Liulin measurements are shown as red diamonds. The NAIRAS predictions are shown as green squares. The blue triangles are estimated corrections to the NAIRAS results due to pion-initiated electromagnetic cascade processes. The 1 min Liulin data shown in Figure 7 have been averaged over roughly 1 h periods, which is shown in this figure. The horizontal errors bars in the above figure correspond to the averaging interval. The vertical error bars represent the standard error in the Liulin data.
[83] There are two features of the NAIRAS/TEPC and NAIRAS/Liulin differences that are discussed below. One, the measurement and model differences are largest at low latitudes and high geomagnetic cutoff rigidities. Two, NAIRAS/Liulin differences are significantly larger than the NAIRAS/TEPC differences, indicating that errors in charged particle transport dominate over neutron transport in the NAIRAS model. Off-line model simulations suggest that pion-initiated electromagnetic cascade processes, denoted by π/EM, can partially explain these features. Pions in the atmosphere are produced by nuclear reactions between the primary cosmic ray particles and the constituents of the neutral atmosphere. The charged pions decay into muons, and the neutral pion decays into high-energy photons. The muons subsequently decay into electrons and positrons. The electrons, positrons, and photons interact with the atmospheric constituents producing more electrons, positrons, and photons, generating an electromagnetic cascade. The π/EM processes will increase the charge particle component of the ionizing radiation field and will be comparatively more important at low latitudes and high geomagnetic cutoff rigidities where the primary GCR spectrum is dominated by high-energy ions with sufficient energy to create a copious number of pions.
[84] Figures 22 and 23 show the particle contributions to absorbed dose in silicon and tissue dose equivalent at 0 GV and 15 GV vertical geomagnetic cutoff rigidities, respectively. The particle contributions include the π/EM generated particles using the deterministic code developed by Norman et al.[2012, 2013], and dose equivalent at zero depth in tissue is used as a proxy for ambient dose equivalent. Figure 2, representative of high latitudes, shows that π/EM processes contribute less than 15% to tissue dose equivalent at commercial airline cruising altitudes but up to 50% of absorbed dose in silicon. Therefore, model errors in charged particle transport will have a larger influence on absorbed dose in a thin material, such as a silicon detector, compared to tissue dose equivalent. These features are enhanced at low latitudes and high cutoff rigidities. For the representative case shown in Figure 3, the π/EMprocesses contribute up to 25% to tissue dose equivalent at typical cruising altitudes of commercial aircraft, while the contribution to absorbed dose in silicon can be as much as 70%.
Figure 22.
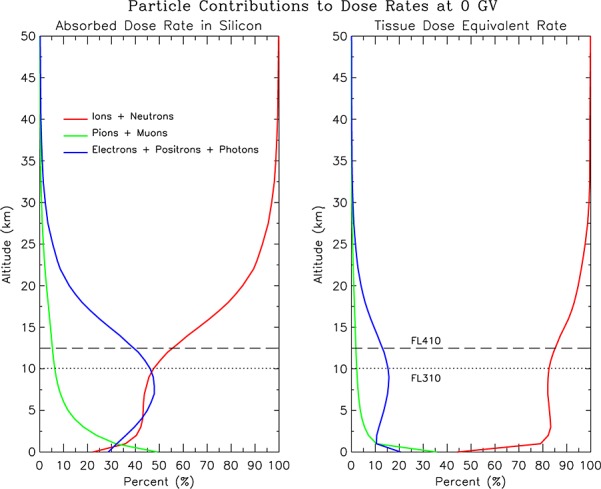
Particle contributions to absorbed dose rate in silicon (left) and tissue dose equivalent (right) for 0 GV vertical geomagnetic cutoff rigidity. The horizontal lines denote the range of commercial aircraft cruising altitudes. The simulations were performed by coupling the π/EM code with HZETRN.
Figure 23.
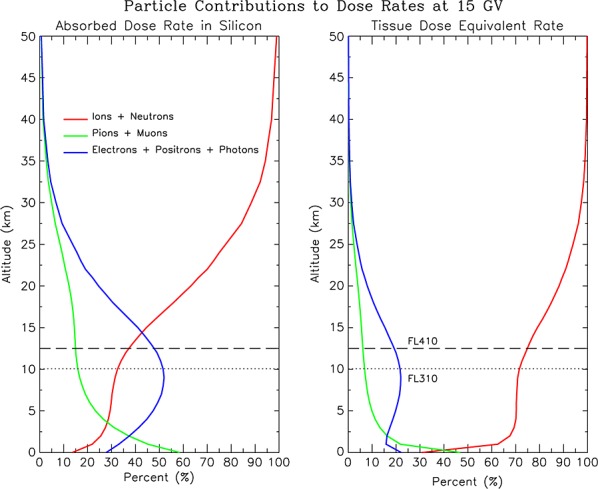
Particle contributions to absorbed dose rate in silicon (left) and tissue dose equivalent (right) for 15 GV vertical geomagnetic cutoff rigidity. The horizontal lines denote the range of commercial aircraft cruising altitudes. The simulations were performed by coupling the π/EM code with HZETRN.
[85] The particle contributions to tissue dose equivalent, shown in Figures 2 and 3 for two representative cutoff rigidities, were used to estimate the likely π/EM contributions to the NAIRAS ambient dose equivalent rates for the two DLR flights. The corrections were estimated for ambient dose equivalent rate since this is the operational quantity used in radiation protection applications. The results of these estimates are shown in Figures 6 and 9. In general, NAIRAS ambient dose equivalent rates were increased by a factor of about 1.37 for the DUS-MRU flight, which reduced the NAIRAS/TEPC differences by about 20%. For the FAI-FRA flight, NAIRAS ambient dose equivalent rates were increased by about a factor of 1.20, which increased the NAIRAS/TEPC differences by roughly 20%. Overall, the estimated NAIRAS/TEPC differences for the two DLR flights are within approximately ± 30% with the π/EM processes included in the NAIRAS model.
[86] The π/EM contributions can explain the NAIRAS model underprediction, relative to the ICRU reference data, of the slope of the dose rate versus flight level in the polar region but not in the equatorial region where the cutoff rigidity is high. This topic was first discussed in the previous section. By using tissue dose equivalent as a proxy for ambient dose equivalent and estimating the π/EM contributions to the NAIRAS results as discussed above, the slope in the dose rate with respect to flight level at zero cutoff rigidity is 0.0430 μSv/(h 100 ft). This value is in reasonable agreement with both the ICRU reference data [ICRU, 2010] and the 2006–2008 flight measurements analyzed by Meier et al. [2009]. However, the estimated π/EM contributions do not alter the slope in the ambient dose equivalent rate versus flight level in the equatorial region at all.
[87] As stated previously, the π/EM processes are not included in HZETRN 2010 version, which is the version integrated into the NAIRAS model. The deterministic π/EM code is in the preliminary stage of testing and integration into HZETRN [Norman et al., 2012, 2013]. An initial validation of the π/EM code has been performed by comparing the results to Monte Carlo transport codes and dosimetric measurements taken on the International Space Station [Slaba et al., 2013]. The π/EM code will be included in the 2015 version of HZETRN and integrated into NAIRAS at that time.
[88] An additional tool is available via the PARMA model for assessing the role of π/EM processes on atmospheric dosimetric quantities. The PHITS-based Analytical Radiation Model in the Atmosphere (PARMA) is a set of analytical functions fit to Particle and Heavy Ion Transport System (PHITS) Monte Carlo code simulations of cosmic ray transport through the atmosphere [Sato et al., 2008]. The PHITS simulations are used to fit analytic functions of proton, alpha, electron, positron, photon, and muon spectral flux with respect to three independent variables: solar cycle modulation, geomagnetic cutoff rigidity, and atmospheric depth. This approach differs from the deterministic π/EM code of Norman et al.[2012, 2013]: the deterministic code explicitly solves the coupled transport equations for each specification of solar modulation potential, cutoff rigidity, and atmospheric depth. Future work will entail direct spectral flux comparisons of the key electromagnetic cascade products (electrons, positrons, and photons) between the PARMA model and the π/EM code, and a comparison of the influence of these particles on the atmospheric dosimetric quantities predicted by each code.
[89] The recent assessments of widely available heliospheric GCR models are discussed in the context of the comparisons between NAIRAS and the DLR flight measurements shown in this section. Mrigakshi et al. [2012] compared several models, including BON10, with GCR spectral flux measurements taken from various satellite and high-altitude balloon platforms. Although BON10 overall performed the best of the models considered, all models failed to reproduce the amount of increased heavy-ion GCR flux observed during the minimum between solar cycle 23 and solar cycle 24 in 2009–2010. The paucity of proton and alpha measurements during this time period made model comparisons unreliable for these ions. Zhao and Qin [2013] developed an empirical heavy-ion GCR model that claims to be more accurate than the Badhwar and O'Neill model; however, it appears that this assessment was based on a very old version of the Badhwar and O'Neill model. Matthiä et al. [2013] recently developed an empirical GCR model that is also suited for real-time applications. This model was shown to be more accurate than the BON10 when compared to heavy-ion flux measurements, even during the recent period of solar cycle minimum.
[90] One common element in the above discussion is that although the BON10 outperforms most models considered, it is still not fully capturing the increased GCR flux during the recent deep solar cycle minimum. However, the NAIRAS model dose rates are in good agreement with the DLR high-latitude aircraft radiation measurements presented in this section. It is important in assessing the overall NAIRAS model performance to know if the H-BON10 model, in addition to its use in real-time applications, provides an improvement in accuracy over the BON10 model or if there is cancelation of errors such that the accurate NAIRAS predictions at high latitudes is accidental. As a result, the subject of future work will include separate comparisons between H-BON10 and other widely available helisopheric GCR models. Furthermore, new radiation measurements on high-altitude balloon platforms will be taken during the Radiation Dosimetry Experiment (RaD-X) flight mission in order to characterize the uncertainty in the NAIRAS model prediction of primary GCR dose quantities. The RaD-X mission is funded by the NASA Science Mission Directorate and is currently scheduled to launch in 2015. These are some of the steps that will be taken to continue the assessment and advancement of the NAIRAS model.
3.4 Validation Assessment
[91] The ICRU has made recommendations on the acceptance levels for total uncertainty in radiation protection measurements and assessments of dose [ICRU, 1992, 2001]. These recommendations are broadly consistent with ICRP statements. For aircraft cosmic radiation exposure at flight altitudes, the combined relative standard uncertainty should not exceed 30% for an assessment of ambient dose equivalent equal to or greater than an annual dose of 1 mSv [ICRU, 2010].
[92] The above ICRU criterion on acceptable uncertainty in dose assessment was applied to the NAIRAS comparisons in the following way. The model/measurement differences in Tables 6 were averaged together for dose rates that would equate to or exceed an annual ambient dose equivalent of 1 mSv. The annual dose was estimated by multiplying the measurements of the ambient dose equivalent rates in Tables 6 by the annual block hours of a representative pilot. In a recent epidemiological study of U.S. commercial airline pilots, composed of 523,387 individual flight segments between 1963 and 2003, the median pilot flew 14,959 block hours for 27.8 years, yielding 538 for the annual block hours [Grajewski et al., 2011]. To be conservative, 800 block hours was assumed. This is a reasonable upper limit since 817 hours was the longest annual pilot flight time recorded in the recent survey of radiation exposure to Air Canada pilots [Bennett et al., 2013]. As a result, the model/measurement differences in Tables 6 were averaged together for all measurements of ambient dose equivalent rates that exceeded 1.25 μSv/h. Equivalently, the model/measurement differences in the tables were averaged together for geomagnetic cutoff rigidities less than or equal to ∼10 GV. By applying the ICRU criterion to the NAIRAS/measurement comparisons in Tables 6, as described above, the combined uncertainty in the NAIRAS prediction of ambient dose equivalent rate is within 25%.
[93] It is estimated, based on the discussion in the previous section, that the NAIRAS model uncertainty for GCR conditions will be roughly within 30% for any single-point comparison, irrespective of an annual dose greater than or equal to 1 mSv, after the π/EM code is included in the HZETRN 2015 version and subsequently integrated into the NAIRAS model. This expectation will be quantitatively assessed in the near future.
4. Summary and Conclusions
[94] A detailed description of the NAIRAS model was given, focusing on GCR transport and dosimetry under quiet geomagnetic conditions. Transport through the heliosphere is based on the H-BON10 model, which was developed for real-time applications by parameterizing the solar modulation potential in the BON10 model in terms of high-latitude neutron monitor data. The transport and interactions between the primary GCR particles and the constituents of the neutral atmosphere are modeled using the HZETRN version 2010 code. The NAIRAS model computes the fundamental spectral flux for neutrons and 58 other fully ionized nuclear isotopes ranging from hydrogen through nickel. The particle flux spectra, in turn, are used to compute the primary dosimetric quantities that are important for radiation protection applications and model verification and validation—namely, effective dose rate, ambient dose equivalent rate, and absorbed dose rate in silicon. NAIRAS is a free-running physics-based model in the sense that no adjustment factors are applied to nudge the model into agreement with measurement data.
[95] Five decades of global, annual-average dose rates, computed by the NAIRAS model, were used to construct a climatology of effective dose and ambient dose equivalent rates representative of solar maximum and solar minimum conditions. Both the effective dose and ambient dose equivalent rates are on the order of ∼1 μSv/h at the equator for typical commercial airline cruising altitudes, with a roughly 20% variation between solar maximum and solar minimum. The dose rates in the polar region differ by about a factor of 2 between solar maximum and solar minimum at airline flight levels. For solar maximum, the effective dose and ambient dose equivalent rates at aircraft altitudes in the polar region are in the range of ∼4–5 μSv/h and ∼3–4 μSv/h, respectively. The effective dose and ambient dose equivalent rates at airline altitudes are in the range ∼9–10 μSv/h and ∼7–8 μSv/h, respectively, for solar minimum conditions in the polar region.
[96] The NAIRAS model predictions of GCR atmospheric radiation dose rates were compared with ICRU tabulated reference measurement data [ICRU, 2010] and compared to onboard aircraft radiation measurements taken in 2008. The ICRU reference measurements covered the typical range of commercial aircraft cruising altitudes and the full range of geomagnetic cutoff rigidities and solar cycle activity characteristics. The NAIRAS/ICRU comparisons of ambient dose equivalent rate were generally within ± 50% for any single-point comparison and generally within 25% at cutoff rigidities less than 4 GV (or latitudes poleward of 30°). Radiation measurements taken by DLR in 2008 on a high-latitude and a low-latitude flight during the minimum between solar cycle 23 and solar cycle 24 were also analyzed. The two DLR flight measurements covered the range of geomagnetic cutoff rigidities at commercial aircraft flight levels. The NAIRAS/DLR-TEPC comparisons of ambient dose equivalent rates were generally within 10% for the high-latitude flight and roughly within 50% for the low-latitude flight.
[97] The ICRU criterion on acceptable uncertainty in dose assessment of aircraft ionizing radiation exposure at commercial flight levels is that the combined relative standard uncertainty should not exceed 30% for an assessment of ambient dose equivalent equal to or greater than an annual dose of 1 mSv. When this criterion is applied to the combined NAIRAS/ICRU and NAIRAS/DLR comparisons, the model/measurement differences are within ∼25%. Therefore, based on the ICRU/ICRP criterion, the NAIRAS model can be reliably used in commercial aircraft radiation risk assessment and radiation mitigation decisions for GCR exposure.
[98] Due to limited availability and accessibility to aircraft radiation measurements during solar-geomagnetic storms, NAIRAS model predictions of SEP atmospheric radiation exposure have not yet been validated. Continuous aircraft radiation measurements on select high-latitude flights would quickly close the measurement data gap that is prohibiting the development and validation of accurate and reliable aircraft radiation model predictions during radiation and geomagnetic storms.
[99] The largest differences between the NAIRAS model GCR atmospheric dose predictions and the aircraft radiation measurements presented in this paper consistently occurred at low latitudes where the geomagnetic cutoff rigidity is high. The NAIRAS/Liulin comparisons of absorbed dose rate in silicon, combined with off-line model simulations, revealed that π/EM processes missing in the HZETRN 2010 version can partially explain the underprediction of the NAIRAS model at high cutoff rigidities. Model simulations also estimate that including the π/EM processes can increase NAIRAS model calculations of ambient dose equivalent by 20% or more for high cutoff rigidities, suggesting that NAIRAS model/measurement differences may be within 30% for any single-point comparison. This expectation will be explicitly evaluated when the HZETRN version 2015, which will include the electromagnetic cascade particles via the deterministic π/EM code, is integrated into the NAIRAS model. Part of the HZETRN-π/EM validation of atmospheric dosimetric quantities calculated by the NAIRAS model will include comparisons with dosimetric quantities computed using the PARMA analytic functions.
[100] In the meantime, there are a number of upcoming opportunities to continue NAIRAS model validation activities. The Automated Radiation Measurements for Aviation Safety (ARMAS) project, funded by the NASA Small Business Innovation Research (SBIR) Program and led by Space Environment Technologies, will conduct 50 or more hours of radiation dosimetry measurements on a NASA DC-8 aircraft. The dosimetry measurements will be taken by a Hawk version 2.0 TEPC and a total ionizing dose detector (TID) developed by The Aerospace Corporation and manufactured by Teledyne microelectronic technologies [Mazur et al., 2011]. The NASA Minority University Research and Education (MUREP) program has funded a project to conduct microdosimetry measurements in microgravity. The dosimetry measurements collected by the ARMAS project and the MUREP program will be compared to NAIRAS model predictions for a range of altitudes not included in the ICRU and DLR measurement data. Furthermore, H-BON10, developed specifically for the NAIRAS model, will be compared to other widely available heliospheric GCR models, in order to isolate NAIRAS model uncertainty in specifying the GCR spectral flux outside the geospace environment. This effort will be complemented by the dosimetry measurements taken from a high-altitude balloon platform during the NASA Radiation Dosimetry Experiment (RaD-X) flight mission, currently scheduled for 2015. These model comparisons and measurement campaigns will broaden the assessment of the NAIRAS model performance, which will inevitably lead to further improvements in accuracy and reliability.
Acknowledgments
[112] This material is based upon work partially supported by the National Aeronautics and Space Administration (NASA) through Decision Support Through Earth Science Results and Living With A Star Targeted Research and Technology Programs under the Science Mission Directorate, the Human Research Program under the Human Exploration and Operations Mission Directorate, and the Advanced Radiation Protection Project under the Space Technology Mission Directorate's Game Changing Development Program. Mr. Brown contributed to this work under the NASA Langley Aerospace Research Summer Scholars (LARSS) Program and was partially supported by the North Carolina Space Grant Consortium. The authors would like to gratefully acknowledge the generous support with flight opportunities by the airline partners LTU Lufttransport-Unternehmen GmbH and Condor Flugdienst GmbH, which led to the flight data reported in section 3.3. Furthermore, the authors would like to express their gratitude to Captain Michael Nezel for his personal commitment in planning and performing the measuring flights reported in section 3.3.
Appendix A: GCR Transport Through Interplanetary Space
[101] This section contains a detailed summary of the derivation of the GCR heliospheric transport equation and the subsequent approximations that reduce the generalized transport equation to the steady state, radially symmetric form that is solved in the H-BON10 model. The material presented in this section provides the underlying physical description of the H-BON10 model that does not appear in previous publications on the Badhwar and O'Neill model. This section also provides a reference description from which to facilitate future improvements in heliospheric GCR transport physics applicable to space radiation environment modeling.
A1. Radial Transport Equation
[102] A Boltzmann transport equation for the GCR gas in the interplanetary region can be derived based on the principle of particle conservation. By integrating the Boltzmann transport equation over all directions of momentum, which are assumed to be isotropically distributed in the frame of reference moving with the bulk solar wind velocity, the transport equation takes the form of a continuity equation in phase space [Gleeson and Webb, 1978], such that
 |
A1 |
In the above equation,  is the differential number density with respect to momentum p⋆,
  is the differential current density in momentum space, and
  is the time rate of change of momentum at position r averaged over all directions of particle momentum. Bold-face font refers to vector quantities. The subscript i refers to the ith vector component, and the superscript ⋆ refers to quantities evaluated relative to the bulk solar wind velocity. The Einstein summation convention is used where repeated indices are summed over. The differential number density is related to the Boltzmann phase space distribution function (f) by Up=4π p2f(p), and the total number density is given by
| A2 |
[103] The standard physical description of GCR transport through the heliosphere is convection by the solar wind and diffusion through the interplanetary magnetic field [Parker, 1965]. In the Parker theory, charged particles are convected by the mean interplanetary magnetic field carried by the solar wind. Superposed on the mean field are magnetic irregularities through which charged particles diffuse by scattering processes. In the coordinate frame fixed to the bulk solar wind velocity, the differential current density is given by
 |
A3 |
where κis the diffusion tensor. The diffusive differential current density in (29) can be derived from the first moment of the Boltzmann transport equation by assuming that the time scale for changes in the motion of the cosmic ray gas are long compared to the inverse of the cyclotron frequency, and long compared to the time interval between scattering of charged particles by the magnetic irregularities [Axford, 1965; Quenby, 1967].
[104] To describe the cosmic ray gas distribution at Earth, for example, the GCR transport equation must be specified in a fixed coordinate system with respect to the heliosphere. However, care must be taken in transforming the equations in (27) and (29) from the coordinate system moving with the solar wind to the fixed coordinate system with respect to the heliosphere. There is a kinematic anisotropy associated with this coordinate transformation, due to the difference in kinetic energy of a given particle seen by a stationary observer in the heliosphere relative to an observer moving with the solar wind. This effect is generically referred to as the Compton-Getting anisotropy [Forman, 1970; Jokipii and Parker, 1970], a factor which is given in momentum space by
 |
A4 |
where Vi is the ith component of the bulk solar wind velocity and w is the charged particle (isotropic) velocity. Thus, transforming the differential current density from the moving frame to the fixed frame is accomplished by adding the term (1/3)wUpδCG,i to (29). Furthermore, the differential number density Up(r,p,t) defined in the fixed frame is related to the differential number density in the solar wind frame by
 |
A5 |
Consequently, for V2/w2≪1, the cosmic radiation differential number density in the coordinate system fixed relative to the heliosphere satisfies the same continuity equation as in (27), i.e.,
| A6 |
but with the differential current density given by [Jokipii and Parker, 1967, 1970; Gleeson, 1969; Gleeson and Webb, 1978]
 |
A7 |
where
 |
A8 |
In the fixed frame, the differential current density includes, in addition to the diffusive term, the convection term VUp modified by the spectrum-dependent Compton-Getting factor C.
[105] Provided there are no significant fluctuations in the solar wind speed—i.e., neglecting Fermi acceleration—the dominant cosmic radiation energy change process in the inner heliosphere is adiabatic deceleration, due to the expanding magnetic fields carried by the solar wind [Jokipii and Parker, 1967, 1970; Gleeson and Webb, 1978]. In the fixed frame, this directionally averaged—i.e., with respect to momentum—dissipative force is given by
 |
A9 |
[106] The heliospheric GCR transport equation is obtained by substituting (33)-(35) into (32) [Gleeson and Webb, 1978]:
| A10 |
It is more convenient to solve the transport equation for the differential number density as a function of kinetic energy per nucleon (E) rather than momentum. Denoting the differential number density with respect to kinetic energy per nucleon as simply U=U(r,E,t), the partial derivative with respect to momentum in (36) can be replaced by a partial derivative with respect to kinetic energy per nucleon by making the variable transformation
| A11 |
where
| A12 |
and E0 is the rest mass energy per nucleon of the given particle. Thus, the transport equation for the differential number density with respect to kinetic energy per nucleon is given by
| A13 |
The above equation is the result given by Parker[1965, 1966] for the transport of energetic charged particles through the heliosphere. It is the starting point in the development of the H-BON10 model, and it still remains the starting point in many modern studies of cosmic ray transport [e.g., Burger et al., 2000; Potgieter, 2000; Florinsky and Jokipii, 2003; Florinski et al., 2003; Webb et al., 2003; Caballero-Lopez and Moraal, 2004; Quenby et al., 2008; Strauss et al., 2011].
[107] An effective 1-D heliospheric GCR transport equation can be derived from (39) by assuming radial symmetry. The result of this assumption is
 |
A14 |
where r is the radial distance from the Sun and Vsw is the bulk solar wind speed in the radial direction.
A2. Steady State Radial Solution
[108] In this section, a steady state solution to the 1-D heliospheric transport equation in (40) is obtained. To aid in understanding the physics, the steady state solution of (40) can be expressed in terms of coupled equations between a pseudo radial current density,  , and the differential number density, so that
 |
A15 |
where it is assumed that  vanishes at the outer boundary of the heliosphere, rB, and
 |
A16 |
In this representation, adiabatic energy loss manifests as a source term for the differential number density as the charged particles cascade down in energy due to the expanding interplanetary magnetic field carried by the solar wind. The ratio of the solar wind speed to the diffusion coefficient is an attenuation coefficient that increases the deeper the cosmic ray particles penetrate into the heliosphere. With respect to the approximate 11 year solar cycle, the exponential factor in (42) is a solar modulation function. Note that in steady state, time t is a parameter that specifies the phase of the 11 year solar cycle.
[109] Gleeson and Axford [1968] showed that the radial current density is negligible for η≡VswR/κrr≪1, where R is a length characteristic of the radial variation in the diffusion coefficient κrr. For quiet solar wind conditions where Vsw ≈ 400 km/s, and given that κrr≈ 1022 cm2 s−1, η≪1 provided that R≤ 1 AU. However, since κrr scales with energy (or rigidity) [Axford, 1965], η≪1 for sufficiently high energies independent of R. Thus, when the condition for negligible radial current density is met (i.e., η≪1), the cosmic radiation differential number density is approximated by
| A17 |
where M is the solar modulation function of Balasubrahmanyan et al. [1967].
[110] However, the Gleeson and Axford [1968] condition is not met at charged particle kinetic energies on the order of ∼400 MeV/n or less for protons, which is near the peak in the modulated GCR spectrum at 1 AU. This is based on R∼1 AU, which seems to be supported by analysis of neutron monitor data [Gleeson and Axford, 1968]. The characteristic radial variation in the Badhwar and O'Neill diffusion coefficient, on the other hand, is roughly 8–9 AU (see section 2.1.2), which is due to r0=4 AU in (4). The value of r0 in the Badhwar and O'Neill model was not derived based on physical arguments but was simply determined from best fit comparisons to measurement data [O'Neill, 2006]. Nevertheless, the main point is that at low enough energy, radial streaming of the cosmic ray gas is no longer negligible. In the Badhwar and O'Neill model, the radial current density is not assumed to be negligible and adiabatic energy loss is included in the solution of the radial transport equation, which is represented by the second term in the equation below.
[111] In addition to the assumption of radial symmetry, the steady state heliospheric GCR transport equation in the Badhwar and O'Neill model also assumes a constant solar wind speed. In this case, equation (40) reduces to
 |
A18 |
The above equation is solved numerically given a specification of the key transport coefficient, which is defined as the ratio κrr/Vsw, and given the boundary condition on the differential number density, as described in sections 2.1.2 and 2.1.3.
References
- Adamczyk A M, Norman R B, Sriprisan S I, Townsend L W, Norbury J W, Blattnig S R. Slaba T C. NUCFRG3: Light ion improvements to the nuclear fragmentation model. Nucl. Instrum. Methods Phys. Res., Sect. A. 2012;628:21–32. doi: 10.1016/j.nima.2012.02.021. [DOI] [Google Scholar]
- AMS. Washington, D. C. 2007. Integrating space weather observations and forecasts into aviation operations, Technical Report, American Meteorological Society Policy Program & SolarMetrics.
- Aspholm R, Lindbohm M-L, Paakkulainen H, Taskinen H, Nurminen T. Tiitinen A. Spontaneous abortions among Finnish flight attendants. J. Occup. Environ. Med. 1999;41(6):486–491. doi: 10.1097/00043764-199906000-00015. [DOI] [PubMed] [Google Scholar]
- Axford W I. The modulation of galactic cosmic rays in the interplanetary medium. Planet. Space Sci. 1965;13:115–130. [Google Scholar]
- Badhwar G D, O'Neill P M. An improved model of galactic cosmic radiation for space exploration missions. Nucl. Tracks Radiat. Meas. 1992;20:403–410. [Google Scholar]
- Badhwar G D, O'Neill P M. Time lag of twenty-two year solar modulation, 23rd Int. Cosmic Ray Conf. 1993;3:535–539. [Google Scholar]
- Badhwar G D, O'Neill P M. Long term modulation of galactic cosmic radiation and its model for space exploration. Adv. Space Res. 1994;14:749–757. doi: 10.1016/0273-1177(94)90537-1. [DOI] [PubMed] [Google Scholar]
- Badhwar G D, O'Neill P M. Galactic cosmic radiation model and its applications. Adv. Space Res. 1996;17:7–17. doi: 10.1016/0273-1177(95)00507-b. [DOI] [PubMed] [Google Scholar]
- Balasubrahmanyan V K, Boldt E, Palmer R A R. Solar modulation of galactic cosmic rays. J. Geophys. Res. 1967;72(1):27–36. [Google Scholar]
- Bennett L G I, Lewis B J, Bennett B H, McCall M J, Bean M, Doré L. Getley I L. A survey of the cosmic radiation exposure of Air Canada pilots during maximum galactic radiation conditions in 2009. Radiat. Meas. 2013;49:103–108. [Google Scholar]
- Burger R A, Potgieter M S, Heber B. Rigidity dependence of cosmic ray proton latitudinal gradients measured by the Ulysses spacecraft: Implications for the diffusion tensor. J. Geophys. Res. 2000;105(A12):27,447–27,455. [Google Scholar]
- Caballero-Lopez R A, Moraal H. Limitations of the force field equation to describe cosmic ray modulation. J. Geophys. Res. 2004;109:A01101. doi: 10.1029/2003JA010098. [DOI] [Google Scholar]
- Chang S-Y, Kim B-H. Understanding of the microdosimetric quantities obtained by a TEPC. J. Nucl. Sci. Technol., Suppl. 2008;5:213–216. [Google Scholar]
- Copeland K, Sauer H H, Duke F E, Friedberg W. Cosmic radiation exposure on aircraft occupants on simulated high-latitude flights during solar proton events from 1 January 1986 through 1 January 2008. Adv. Space Res. 2008;42:1008–1029. [Google Scholar]
- Dachev T P. Characterization of the near Earth radiation environment by Liulin type spectrometers. Adv. Space Res. 2009;44:1441–1449. [Google Scholar]
- Dyer C, Hands A, Lei F, Truscott P, Ryden K A, Morris P, Getley I, Bennett L, Bennett B. Lewis B. Advances in measuring and modeling the atmospheric radiation environment. IEEE Trans. Nucl. Sci. 2009;56(8):3415–3422. [Google Scholar]
- Englemann JJ, et al. Charge composition and energy spectra of cosmic-ray nuclei for elements from Be to Ni: Results from HEAO-3-C2. Astron. Astrophys. 1990;233:96–111. [Google Scholar]
- Ferrari A, Pelliccioni M, Pillon M. Fluence to effective dose and effective dose equivalent conversion coefficients for protons from 5 MeV to 10 TeV. Radiat. Prot. Dosim. 1997a;71(2):85–91. [Google Scholar]
- Ferrari A, Pelliccioni M, Pillon M. Fluence to effective dose conversion coefficients for neutrons up to 10 TeV. Radiat. Prot. Dosim. 1997b;71(3):165–173. [Google Scholar]
- Finlay CC, et al. International Geomagnetic Reference Field: The eleventh generation. Geophys. J. Int. 2010;183:1216–1230. doi: 10.1111/j.1365-246X.2010.04804.x. [DOI] [Google Scholar]
- Fisher G. Lessons from aviation: Linking space weather science to decision making. Space Weather. 2009;7:S03005. doi: 10.1029/2008SW000432. [DOI] [Google Scholar]
- Forman M A. The Compton-Getting effect for cosmic-ray particles and photons and the Lorentz-invariance of distribution function. Planet. Space Sci. 1970;18:25–31. [Google Scholar]
- Florinski V, Zank G P, Pogorelov N V. Galactic cosmic ray transport in the global heliosphere. J. Geophys. Res. 2003;108(A6):1228. doi: 10.1029/2002JA009695. [DOI] [Google Scholar]
- Florinsky V, Jokipii J R. Cosmic-ray spectra at spherical termination shocks. Astrophys. J. 2003;591:454–460. [Google Scholar]
- Gersey B B, Borak T B, Guetersloh S B, Zeitlin C, Miller J, Heilbronn L, Murakami T, Iwata Y. The response of a spherical tissue equivalent proportional counter to iron particles from 200–10000 MeV/nucleon. Radiat. Res. 2002;157:350–360. doi: 10.1667/0033-7587(2002)157[0350:troast]2.0.co;2. [DOI] [PubMed] [Google Scholar]
- Gersey B, Aghara S, Wilkins R, Wedeking J, Dwivedi R C. Comparison of tissue equivalent and a silicon equivalent proportional counter microdosimeter to high-energy proton and neutron fields. IEEE Trans. Nucl. Sci. 2007;54(6):2276–2281. [Google Scholar]
- Getley I L. Observation of solar particle event on board a commercial flight from Los Angeles to New York on 29 October 2003. Space Weather. 2004;2:S05002. doi: 10.1029/2003SW000058. [DOI] [Google Scholar]
- Getley I L, Duldig M L, Smart D F, Shea M A. Radiation dose along North American transcontinental flight paths during quiescent and disturbed geomagnetic conditions. Space Weather. 2005;3:S01004. doi: 10.1029/2004SW000110. [DOI] [Google Scholar]
- Gleeson L J, Axford W I. Solar modulation of cosmic rays. Astrophy. J. 1968;154:1011–1026. [Google Scholar]
- Gleeson L J. The equations describing the cosmic-ray gas in the interplanetary region. Planet. Space Sci. 1969;17:31–47. [Google Scholar]
- Gleeson L J, Webb G M. Energy changes of cosmic rays in the interplanetary region. Astrophys. Space Sci. 1978;58:21–39. [Google Scholar]
- Gopalswamy N, Yashiro S, Lara A, Kaiser M L, Thompson B J, Gallagher P T, Howard R A. Large solar energetic particle events of solar cycle 23: A global view. Geophys. Res. Lett. 2003;30(12):8015. doi: 10.1029/2002GL016435. [DOI] [Google Scholar]
- Grajewski B, Waters M A, Yong L C, Tseng C-Y, Zivkovich Z, Cassinelli II R T. Airline pilot cosmic radiation and circadian disruption exposure assessment from logbooks and company records. Ann. Occup. Hyg. 2011;55(5):465–475. doi: 10.1093/annhyg/mer024. [DOI] [PMC free article] [PubMed] [Google Scholar]
- Hubiak M. Germany. 2008. Experimentelle Bestimmung von Dosisraten auf Reiseflughoehen im solaren Minimum, Diploma-Thesis.
- IEC. 2006. Process management for avionics—Atmospheric radiation effects—Part 1: Accommodation of atmospheric radiation effects via single event effects within avionics electronic equipment. IEC/TS 62396-1:2006(E), International Electrotechnical Commission.
- ICRP. ICRP Publication 60: 1990 Recommendations of the International Commission on Radiological Protection. 1-3. Vol. 21. Oxford, U. K: Pergamon Press; 1991. [PubMed] [Google Scholar]
- ICRP. ICRP Publication 103: The 2007 Recommendations of the International Commission on Radiological Protection. Vol. 37. Oxford: Elsevier; 2007. pp. 2–4. [DOI] [PubMed] [Google Scholar]
- ICRU. Bethesda, Md. 1992. International Commission of Radiation Units and Measurements, Measurement of dose equivalents from external photon and electron radiations, ICRU Rep. 47, International Commission on Radiation Units and Measurements.
- ICRU. International Commission of Radiation Units and Measurements, Determination of Operational Dose-Equivalent Quantities for Neutrons. Vol. 3. Oxford, U. K: Oxford University Press; 2001. ICRU Rep. 66J. ICRU1. [Google Scholar]
- ICRU. International Commission on Radiation Units and Measurements, Reference Data for the Validation of Doses from Cosmic-Radiation Exposure of Aircraft Crew. Vol. 2. Oxford, U. K: Oxford University Press; 2010. ICRU Rep. 84J. ICRU10. [Google Scholar]
- ISO. 2006. International Organization for Standardization, Dosimetry for Exposers to Cosmic Radiation in Civilian Aircraft—Part I: Conceptual Basis for Measurements, ISO 20785–1:2005 (International Organization for Standardization, Geneva)
- ISO. 2010. International Organization for Standardization, Dosimetry for Exposers to Cosmic Radiation in Civilian Aircraft—Part II: Characterization of Instrument Response, ISO 20785-2:2010 (International Organization for Standardization, Geneva)
- Jokipii J R, Parker E N. Energy changes of cosmic rays in the solar system. Planet. Space Sci. 1967;15:1375–1386. [Google Scholar]
- Jokipii J R, Parker E N. On the convection, diffusion, and adiabiatic deceleration of cosmic rays in the solar wind. Astrophys. J. 1970;160:735–744. [Google Scholar]
- Kalnay E, et al. The NCAR/NCEP 40-year reanalysis project. Bull. Am. Meteorol. Soc. 1996;77:437–470. [Google Scholar]
- Kataoka R, Sato T, Hiroshi Y. Predicting radiation dose on aircraft from solar energetic particles. Space Weather. 2011;9:S08004. doi: 10.1029/211SW000699. [DOI] [Google Scholar]
- Kress B T, Mertens C J, Wiltberger M. Solar energetic particle cutoff variations during the 29–31 October 2003 geomagnetic storm. Space Weather. 2010;8:S05001. doi: 10.1029/2009SW000488. [DOI] [Google Scholar]
- Lauria L, Ballard T J, Caldora M, Mazzanti C, Verdecchia A. Reproductive disorders and pregnancy outcomes among female flight attendants. Aviat. Space Environ. Med. 2006;77(7):533–559. [PubMed] [Google Scholar]
- Lindborg L, Nikjoo H. Microdosimetry and radiation quality determinations in radiation protection and radiation therapy. Radiat. Prot. Dosim. 2011;143(2–4):402–408. doi: 10.1093/rpd/ncq390. [DOI] [PubMed] [Google Scholar]
- Matthiä D, Berger T, Mrigakshi A I, Reitz G. A ready-to-use galactic cosmic ray model. Adv. Space Res. 2013;51:329–338. [Google Scholar]
- Mazur J E, Crain W R, Looper M D, Mabry D J, Blake J B, Case A W, Golightly M J, Kasper J C, Spence H E. New measurements of total ionizing dose in the lunar environment. Space Weather. 2011;12:S07002. doi: 10.1029/2010SW000641. [DOI] [Google Scholar]
- Meier M M, Hubiak M, Matthiä D, Wirtz M, Reitz G. Dosimetry at aviation altitudes (2006–2008) Radiat. Prot. Dosim. 2009;136(4):251–255. doi: 10.1093/rpd/ncp142. [DOI] [PubMed] [Google Scholar]
- Menn W, et al. The absolute flux of protons and helium at the top of the atmosphere using IMAX. Astrophys. J. 2000;533:281–297. [Google Scholar]
- Mertens C J, Kress B T, Wiltberger M, Blattnig S R, Slaba T S, Solomon S C, Engel M. Geomagnetic influence on aircraft radiation exposure during a solar energetic particle event in October 2003. Space Weather. 2010;8:S03006. doi: 10.1029/2009SW000487. [DOI] [Google Scholar]
- Mertens C J, Kress B T, Wiltberger M, Tobiska W K, Grajewski B, Nenoi M, Xu X. Current Topics in Ionizing Radiation Research. InTech Publisher; 2012. Atmospheric ionizing radiation from galactic and solar cosmic rays. edited by, and, (ISBN 978-953-51-0196-3) [Google Scholar]
- Mrigakshi A I, Matthiä D, Berger T, Reitz G, Wimmer-Schweingruber R W. Assessment of galactic cosmic ray models. J. Geophys. Res. 2012;117:A08109. doi: 10.1029/20012JA017611. [DOI] [Google Scholar]
- Murphy J O, Sampson H, Veblen T T, Villalba R. Regression model for the 22-year Hale solar cycle derived from high altitude tree-ring data. P. Astron. Soc. Aust. 1994;11(2):157–163. [Google Scholar]
- NCRP. Maryland. 2009. National Council on Radiation Protection and Measurements: Ionizing Radiation Exposure of the Population of the United States, NCRP Report No. 160, National Council on Radiation Protection and Measurements.
- Norman R B, Blattnig S R, De Angelis G, Badavi F F, Norbury J W. Deterministic pion and muon transport in Earth's atmosphere. Adv. Space Res. 2012;50:146–155. [Google Scholar]
- Norman R B, Slaba T C, Blattnig S R. An extension of HZETRN for cosmic ray initiated electromagnetic cascades. Adv. Space Res. 2013;51(12):2251–2260. [Google Scholar]
- O'Neill P M. Badhwar-O'Neill galactic cosmic ray model update based on Advanced Composition Explorer (ACE) energy spectra from 1997 to present. Adv. Space Res. 2006;37:1727–1733. [Google Scholar]
- O'Neill P M. Badhwar-O'Neill 2010 galactic cosmic ray flux model—Revised. IEEE Trans. Nucl. Sci. 2010;57(6):3148–3153. [Google Scholar]
- Parker E N. The passage of energetic charged particles through interplanetary space. Planet. Space Sci. 1965;13:9–49. [Google Scholar]
- Parker E N. The effect of adiabatic deceleration on the cosmic ray spectrum in the solar system. Planet. Space Sci. 1966;14:371–380. [Google Scholar]
- Pelliccioni M. Overview of the fluence-to-effective dose and fluence-to-ambient dose equivalent conversion coefficients for high energy radiation calculated using FLUKA. Radiat. Prot. Dosim. 2000;88(4):279–297. [Google Scholar]
- Picone J M, Hedin A E, Drob D P, Aikin A C. NRLMSIS-00 empirical model of the atmosphere: Statistical comparisons and scientific issues. J. Geophys. Res. 2002;107(A12):1468. doi: 10.1029/2002JA009430. [DOI] [Google Scholar]
- Potgieter M S. Heliospheric modulation of cosmic rays protons: Role of enhanced perpendicular diffusion during periods of minimum solar modulation. J. Geophys. Res. 2000;105(A8):18,295–18,303. [Google Scholar]
- Quenby J J. The compatibility of various interplanetary field models with cosmic ray modulation data. Planet. Space Sci. 1967;15:257–275. [Google Scholar]
- Quenby J J, Mulligan T, Blake J B, Mazur J E, Shaul D. Local and nonlocal geometry of interplanetary coronal mass ejections: Galactic cosmic ray (GCR) short-period variations and magnetic field modeling. J. Geophys. Res. 2008;113:A10102. doi: 10.1029/2007JA012849. [DOI] [Google Scholar]
- Sato T, Yasuda H, Niita K, Endo A, Sihver L. Development of PARMA: PHITS-based analytical radiation model in the atmosphere. Radiat. Res. 2008;170:244–259. doi: 10.1667/RR1094.1. [DOI] [PubMed] [Google Scholar]
- Slaba T C, Blattnig S R, Badavi F F. Fast and more accurate transport procedures for HZETRN. J. Comput. Phys. 2010a;229:9397–9417. [Google Scholar]
- Slaba T C, Blattnig S R, Badavi F F. NASA Tech. Rep., NASA TP-2010-21613. 2010b. and Fast and more accurate transport procedures for HZETRN.
- Slaba T C, Blattnig S R, Aghara S K. Coupled neutron transport for HZETRN. Radiat. Meas. 2010c;45:173–182. [Google Scholar]
- Slaba T C, Blattnig S R, Clowdsley M S, Walker S A, Badavi F F. An improved neutron transport algorithm for HZETRN. Adv. Space Res. 2010d;46:800–810. [Google Scholar]
- Slaba T C, Blattnig S R, Reddell B, Bahadori A, Norman R B, Badavi F F. Pion and electromagnetic contribution to dose: Comparisons of HZETRN to Monte Carlo results and ISS data. Adv. Space Res. 2013;52(1):62–78. [Google Scholar]
- Spurný F, Kudela K, Dachev T. Airplane radiation dose decrease during a strong Forbush decrease. Space Weather. 2004;2:S05001. doi: 10.1029/2004SW000074. [DOI] [Google Scholar]
- Stassinopoulos E G, Stauffer C A, Dachev T P, Brucker G J, Tomov B T, Dimitrov P G. NASA Technical Memorandum, NASA/TM-2002-210003 Greenbelt, Md. 2002. and The Liulin-3M radiometer for measuring particle doses in space and on aircraft, NASA Goddard Space Flight Center.
- Stassinopoulos E G, Stauffer C A, Brucker G J. A systematic global mapping of the radiation field at aviation altitudes. Space Weather. 2003;1(1):1005. doi: 10.1029/2003SW000011. [DOI] [Google Scholar]
- Stone EC, et al. The Cosmic-ray isotope spectrometer for the advanced composition explorer. Space Sci. Rev. 1998;86:285–356. [Google Scholar]
- Strauss R D, Potgieter M S, Kopp A, Büsching I. On the propagation times and energy losses of cosmic rays in the heliosphere. J. Geophys. Res. 2011;116:A12105. doi: 10.1029/2011JA016831. [DOI] [Google Scholar]
- Tai H, Bichsel H, Wilson J W, Shinn J L, Cuncinotta F A, Badavi F F. Hampton, Virginia. 1997. and Comparison of stopping power and range databases for radiation transport study, NASA Technical Paper, NASA TP-3644, NASA Langley Research Center.
- Tsyganenko N A, Sitnov N I. Modeling the dynamics of the inner magnetosphere during strong geomagnetic storms. J. Geophys. Res. 2005;110:A03208. doi: 10.1029/2004JA010798. [DOI] [Google Scholar]
- Usoskin I G, Alanko-Huotari K, Kovaltsov G A, Mursula K. Heliospheric modulation of cosmic rays: Monthly reconstruction for 1951–2004. J. Geophys. Res. 2005;110:A12108. doi: 10.1029/2005JA011250. [DOI] [Google Scholar]
- Walker A J. Principles of experimental microdosimetry. Radiat. Prot. Dosim. 1995;61(4):297–308. [Google Scholar]
- Waters M, Bloom T F, Grajewski B. The NIOSH/FAA working women's health study: Evaluation of the cosmic-radiation exposures of flight attendants. Health Phys. 2000;79(5):553–559. doi: 10.1097/00004032-200011000-00012. [DOI] [PubMed] [Google Scholar]
- Webb G M, Ko C M, Zank G P, Jokipii J R. Diffusive-compression acceleration and turbulent diffusion of cosmic rays in quasi-periodic and turbulent flows. Astrophys. J. 2003;595:195–226. [Google Scholar]
- Wilson J W. NASA Technical Note, NASA TND-8381, 27 pp., NASA Langley Research Center Hampton, Virginia. 1977. Analysis of the theory of high-energy ion transport.
- Wilson J W, Townsend L W, Nealy J E, Chung S Y, Hong B S, Buck W W, Lamkin S L, Ganapol B D, Khan F, Badavi F A. NASA Reference Publication. 1989. and BRYNTRN: A baryon transport model.
- Wilson J W, Townsend L W, Schimmerling W, Khandelwal G S, Khan F, Nealy J E, Cucinotta F A, Simonsen L C, Shinn J L, Norbury J W. NASA Technical Memorandum, NASA-RP-1257. 1991. and Transport methods and interactions for space radiation.
- Wilson J W, Cucinotta F A, Shinn J L, Townsend L W. Target fragmentation in radiobiology. NASA Technical Memorandum. 1993;4408 [Google Scholar]
- Wilson J W, Badavi F F, Cucinotta F A, Shinn J L, Badhwar G D, Silberberg R, Tsao C H, Townsend L W, Tripathi R K. NASA Technical Paper, NASA TP-3495. 1995a. and HZETRN: Description of a free-space ion and nucleon transport and shielding computer program.
- Wilson J W, Tripathi R K, Cucinotta F A, Shinn J L, Badavi F F, Chun S Y, Norbury J W, Zeitlin C J, Heilbronn L, Miller J. NASA Technical Paper, NASA TP-3533 Hampton, Virginia. 1995b. and NUCFRG2: An evaluation of the semiempirical nuclear fragmentation database, NASA Langley Research Center.
- Wilson J W, Miller J, Cuncinotta F A, editors. Shielding Strategies for Human Space Exploration. NASA Johnson Space Center: NASA Conference Publication 3360; 1997. and (Eds.) ( [Google Scholar]
- Wilson J W. Overview of radiation environments and human exposures. Health Phys. 2000;79(5):470–494. doi: 10.1097/00004032-200011000-00005. [DOI] [PubMed] [Google Scholar]
- Wilson J W, Joes I W, Maiden D L, Goldhagan P, Goldhagan P, editors. NASA Conference Publication, NASA CP-2003-212155 Hampton, Virginia. 2003. and (Eds.) (Analysis, results, and lessons learned from the June 1997 ER-2 campaign, NASA Langley Research Center.
- Wilson J W, Mertens C J, Goldhagan P, Friedberg W, Angelis G D, Clem J M, Copeland K, Bidasaria H B. NASA Technical Paper, NASA/TP-2005-213935 Washington, D. C. 2005a. and Atmospheric ionizing radiation and human exposure, NASA.
- Wilson J W, Tweed J, Walker S A, Cuncinotta F A, Tripathi R K, Blattnig S, Mertens C J. A benchmark for laboratory exposures with 1 GeV iron ions. Adv. Space Res. 2005b;35:185–193. doi: 10.1016/j.asr.2005.03.108. [DOI] [PubMed] [Google Scholar]
- Zhao L-L, Qin G. An observation-based GCR model of heavy nuclei: Measurements from CRIS onboard ACE spacecraft. J. Geophys. Res. Space Physics. 2013;118:1–12. doi: 10.1002/jgra.50235. [DOI] [Google Scholar]


