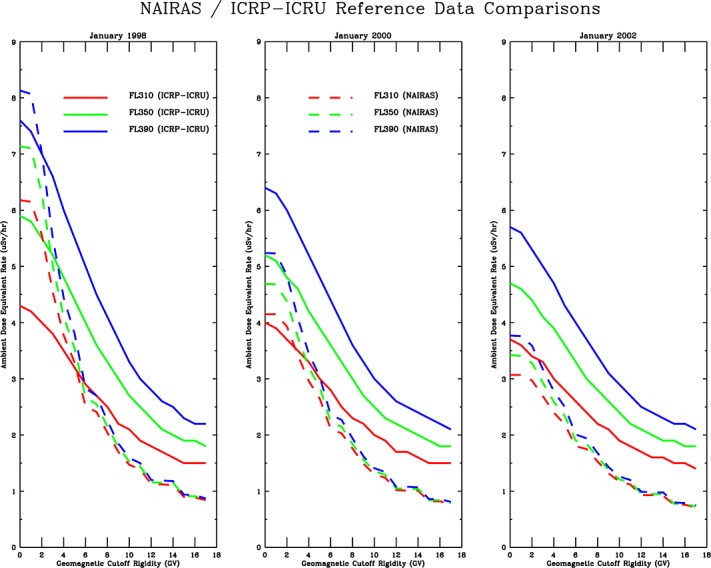
Figure 10.

NAIRAS model comparisons with ICRU reference ambient dose equivalent rate versus vertical geomagnetic cutoff rigidity for different solar activity characteristics. The comparisons for (left) January 1998 (solar minimum, positive polarity), (middle) January 2000 (transitional state), and (right) January 2002 (solar maximum, negative polarity). Each panel shows the ambient dose equivalent rate versus cutoff at flight levels FL310, FL250, and FL390.
