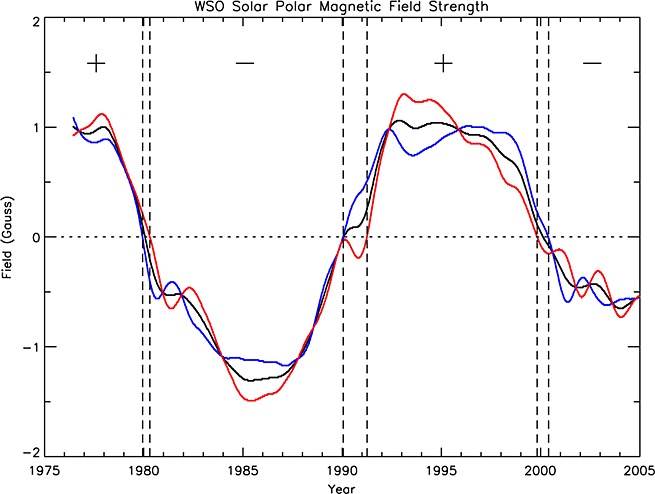
Figure 2.

Solar polar magnetic field data taken by measurements from the Wilcox Solar Observatory (WSO). The blue line is the field strength of the northern solar hemisphere (N). The red line is minus the field strength of the southern solar hemisphere (−S). The black line is the average solar field strength of the Northern and Southern Hemispheres (A=(N−S)/2). Different solar polar magnetic polarity states are separated by vertical dashed lines. The positive and negative polarity states are denoted plus and minus, respectively. The transitional states are the regions of finite temporal width that separate the positive and negative states.
