Figure 5.

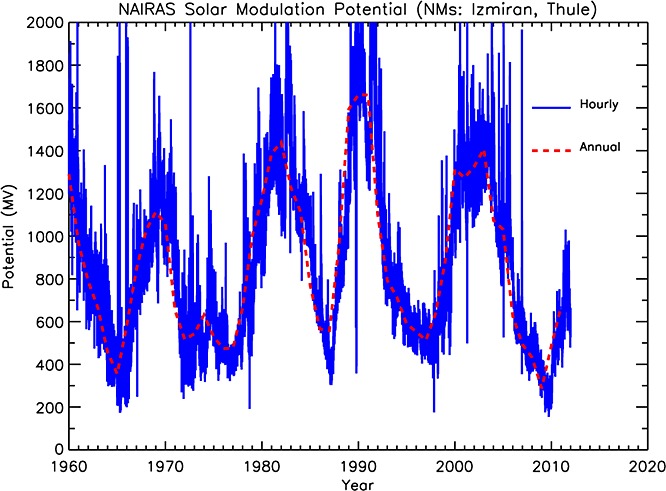
Hourly-average (blue line) and annual-average (red line) solar modulation potential (Φ(t)) determined by the H-BON10 model from Izmiran and Thule neutron monitor count rates.

Hourly-average (blue line) and annual-average (red line) solar modulation potential (Φ(t)) determined by the H-BON10 model from Izmiran and Thule neutron monitor count rates.