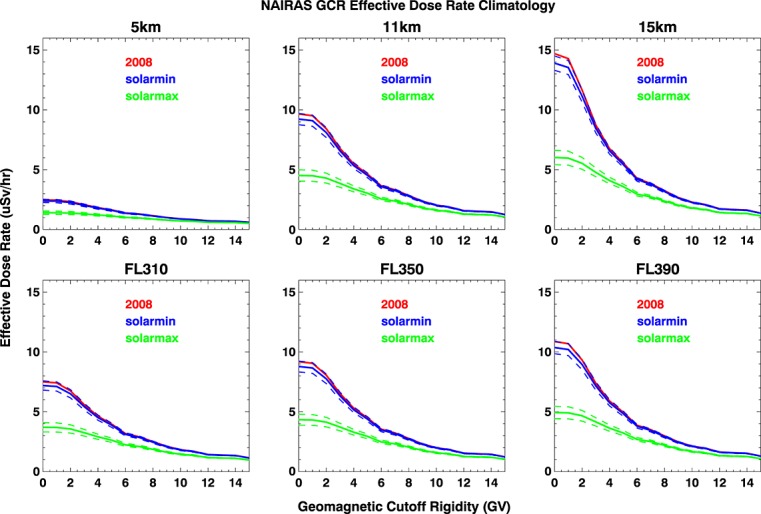
Figure 8.

Climatology of effective dose rates as a function of vertical geomagnetic cutoff rigidity at various altitudes for solar minimum (solid blue line), solar maximum (solid green line), and annual average for year 2008 (solid red line). Dose rates for solar minimum are computed mean values of the annual averages for years 1965, 1977, 1987, 1997, and 2009. Dose rates for solar maximum are computed mean values of the annual averages for years 1960, 1969, 1982, 1991, and 2003. The dashed lines are the solar minimum/maximum (blue/green) averages plus and minus one standard deviation. Flight levels (altitudes denoted with prefix FL) are defined in the text.
