
Figure 11.
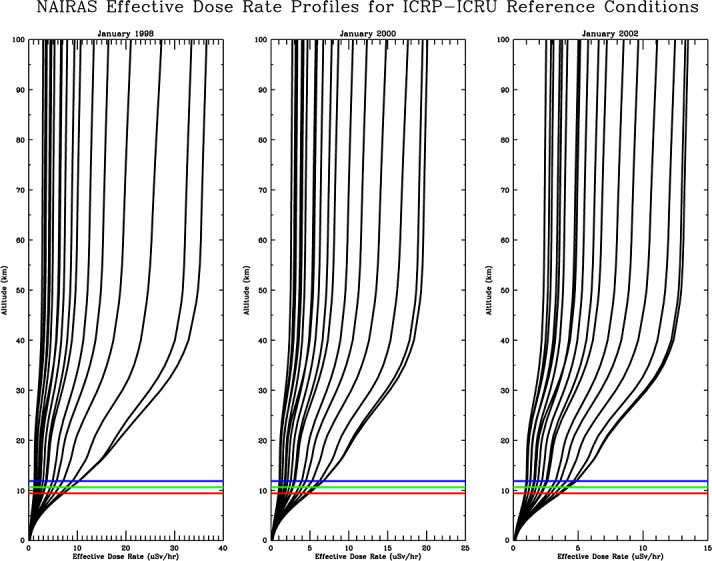
Profiles of NAIRAS model effective dose rates for different solar activity characteristics. Dose rates for (left) January 1998 (solar minimum, positive polarity), (middle) January 2000 (transitional state), and (right) January 2002 (solar maximum, negative polarity). Each panel has profiles of effective dose rates at vertical geomagnetic cutoff rigidities from 0 to 17GV in increments of 1GV. The profiles will be ordered from left to right in each panel from largest to smallest cutoff rigidity.