
Figure 13.
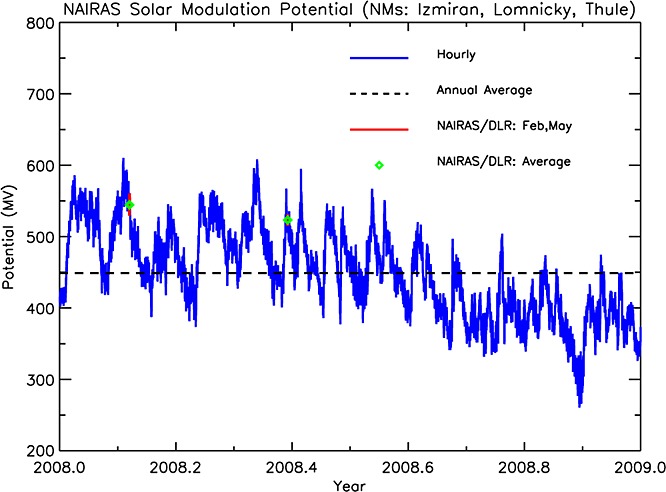
Hourly-average (blue line) and annual-average (dashed black line) solar modulation potential (Φ(t)) for year 2008. The red lines identify Φ(t) during the time period of onboard flight measurements taken by DLR on 13–14 February 2008 and 23 May 2008. The green diamonds denote the average Φ(t) over these time periods of the DLR flight measurements.