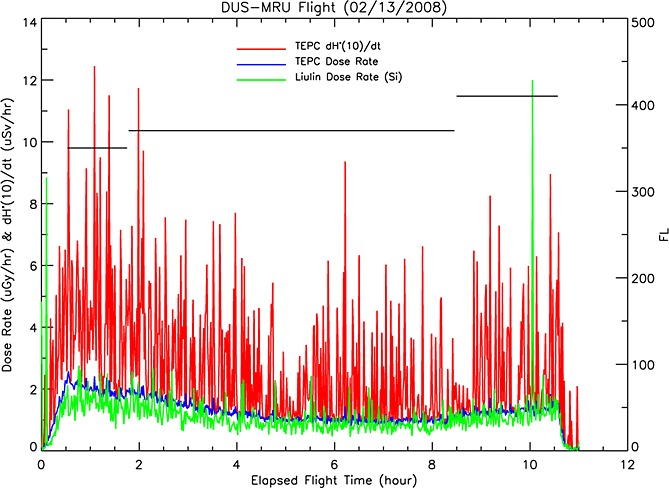
Figure 14.

TEPC and Liulin dosimetric measurements on a flight from Dusseldorf, Germany (DUS) to Mauritius (MRU) on 13–14 February 2008. The left ordinate axis indicates dose rates versus elapsed time of flight (abscissa). The dose rate measurements shown are 1 min averages. The TEPC data shown are (blue line) absorbed dose rate in tissue (μGy/h) and (red line) ambient dose equivalent rate (μSv/h). The Liulin data are (green line) absorbed dose rate in silicon (μGy/h). The right ordinate axis indicates flight level versus elapsed time of flight (abscissa). Note: A correction to the calibration of the Liulin data has produced slightly lower dose rates than shown by Mertens et al. [2012].
