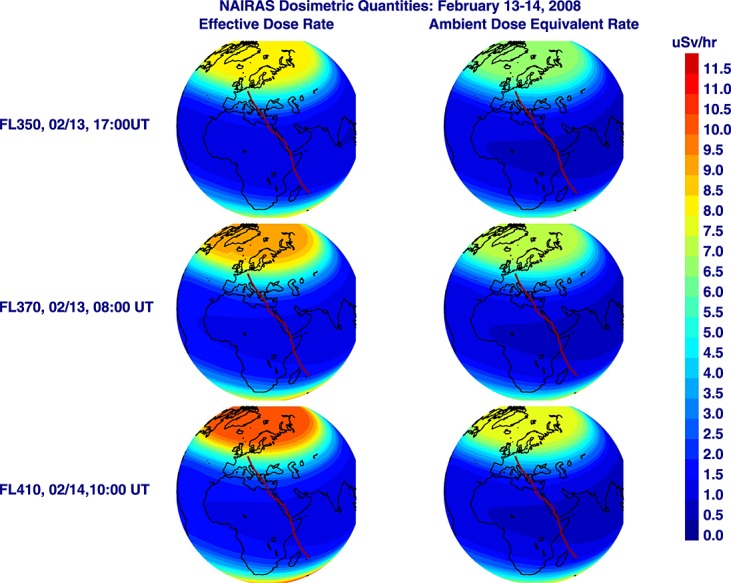
Figure 15.

Effective and ambient dose equivalent rates computed on 13–14 February 2008. The rows show the dose rates at different flight levels (FL), dates, and times during the DLR flight measurements for the Dusseldorf, Germany (DUS) to Mauritius (MRU) flight. The DUS-MRU flight path is overlayed on each dose rate image as a solid red line.
