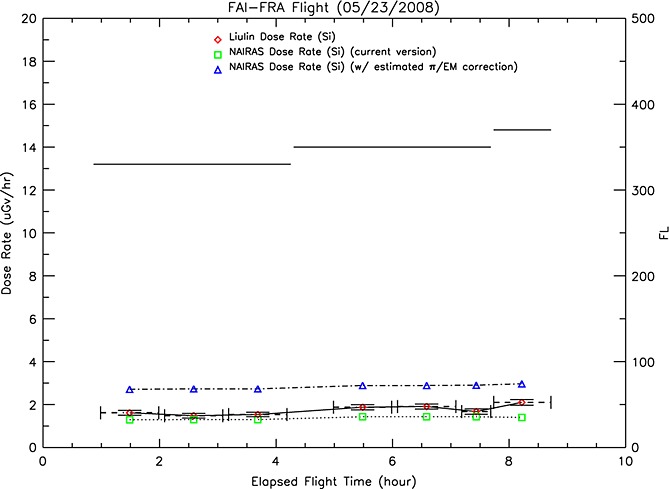
Figure 21.

Liulin/NAIRAS comparisons of absorbed dose rate in silicon for the flight from Fairbanks, Alaska (FAI) to Frankfurt, Germany (FRA) on 23 May 2008. The left ordinate axis indicates absorbed dose rate in silicon versus elapsed time of flight (abscissa). The Liulin measurements are shown as red diamonds. The NAIRAS predictions are shown as green squares. The blue triangles are estimated corrections to the NAIRAS results due to pion-initiated electromagnetic cascade processes. The 1 min Liulin data shown in Figure 7 have been averaged over roughly 1 h periods, which is shown in this figure. The horizontal errors bars in the above figure correspond to the averaging interval. The vertical error bars represent the standard error in the Liulin data.
