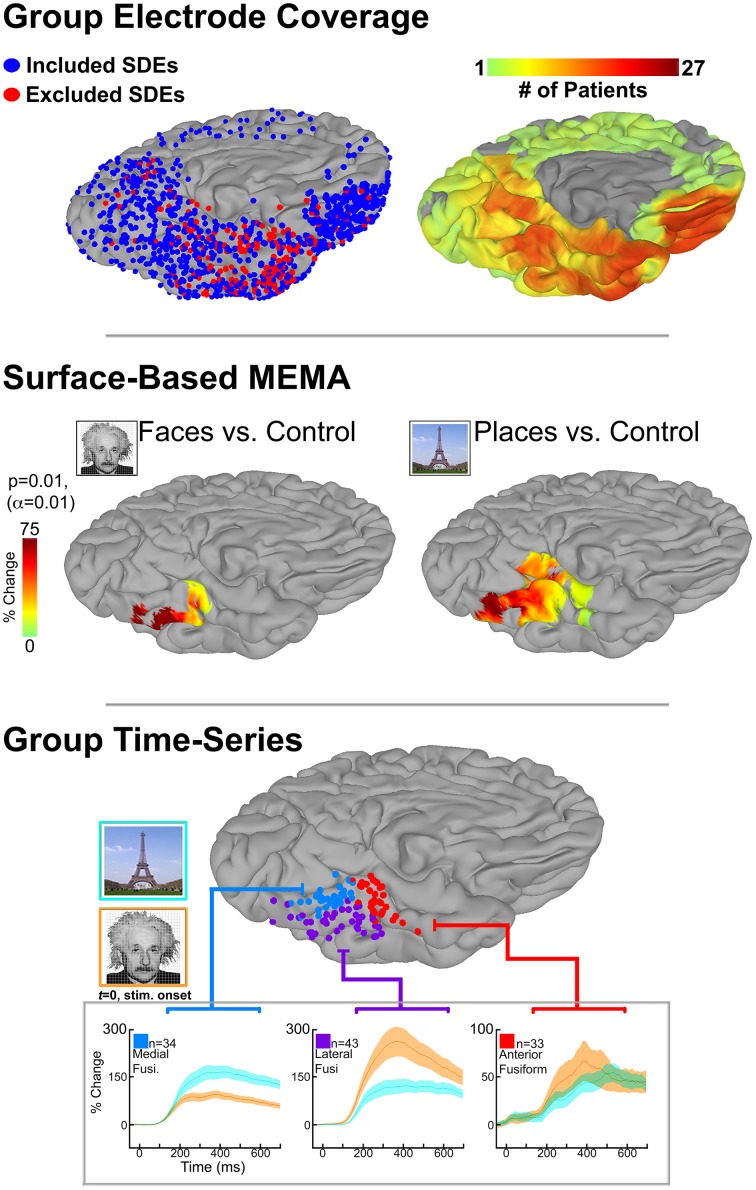
Figure 1.
Top: icEEG data were collected in 27 patients, implanted with subdural electrodes (SDEs) in the left hemisphere, as they performed a visual confrontation naming of famous faces, places, and scrambled control images. Surface-based representations of SDE coverage and high-frequency broadband gamma activity (BGA; 60–120 Hz) were generated for each subject. We utilize cortical surface models that have been reconstructed from each subject's pre-implantation high-resolution anatomical MRI scans (Phillips Medical; T1-weighted, 1 mm isotropic resolution; using FreeSurfer software), and subsequently imported to the SUMA module of AFNI. Surface-based datasets of SDE coverage and BGA are generated with respect to each subject's cortical model using geodesic metrics to correct for local gyral and sulcal folding patterns. By spatially transforming data to the cortical surface, we integrate SUMA's surface-based normalization strategy to convert individual datasets to a standardized cortical surface (N27). To achieve this, SUMA resamples individual cortical models (and therefore their associated datasets) to a standardized mesh and enables a one-to-one correspondence between anatomical locations across subjects. Group maps for electrode (left) and surface-based coverage (right) are shown for the ventral temporal cortex. SDEs are modeled as spheres, with red spheres indicated SDEs that were excluded due to 60 Hz line noise or epileptiform activity. By grouping data in this fashion, comprehensive cortical coverage is obtained, and cognitive function can be critically evaluated at spatio-temporal scales relevant to neural processes. Middle: SB-MEMA derived significant grouped effects estimates by comparing composite BGA percent change (50–500 ms post-stim; with respect to pre-stimulus baseline of −700 to –200 ms) for each stimulus category against its scrambled control. Notably, BGA to faces was localized lateral to the mid-fusiform sulcus, while peak BGA to places was localized medially. Anterior to the mid-fusiform sulcus BGA for both conditions converged in magnitude and spatial extent. Bottom: Subject electrodes localized over the three regions in the fusiform (Fusi.) gyrus with significant activity to faces, places, or both stimuli as revealed by SB-MEMA (see B). SDEs are color-coded by region and displayed on a common brain surface (N27). Notably, SDEs are spatially arranged with respect to the mid-fusiform sulcus: laterally (purple), medially (blue), or anteriorly (red). Below, group time-series of percent change in BGA for face (orange) and place (cyan) stimuli can be seen. Of note, traces colored green indicate a region of activity overlap. Percent change is relative to a pre-stimulus baseline (−700 to −200 ms). Stimulus onset at 0 ms. Shading denotes 1 SEM. All figures display the ventro-medial aspect of the left hemisphere (N27 cortical surface model).

