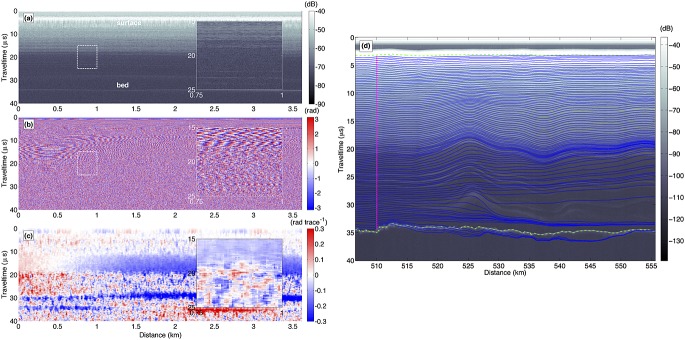
Figure 3.

Example sequence for prediction of radiostratigraphy using horizontal differencing of phase. (a) Returned amplitude and (b) phase of a range-compressed but otherwise unfiltered complex radargram from a single receiver channel collected on 6 May 2011 (2011 P3 campaign; Table 1) (c) Unwrapped, horizontally differenced, and median-filtered phase of the complex radargram. Insets show zoomed-in portion of radargram as white dashed boxes. (d) Δϕ/Δx-predicted radiostratigraphy (blue lines) overlain on the SAR-focused returned amplitude for a larger segment of the same transect that includes the portion shown in Figures3a–3c. Magenta dots represent the points from which the Δϕ/Δx-predicted reflection slope is followed to then predict the radiostratigraphy.
