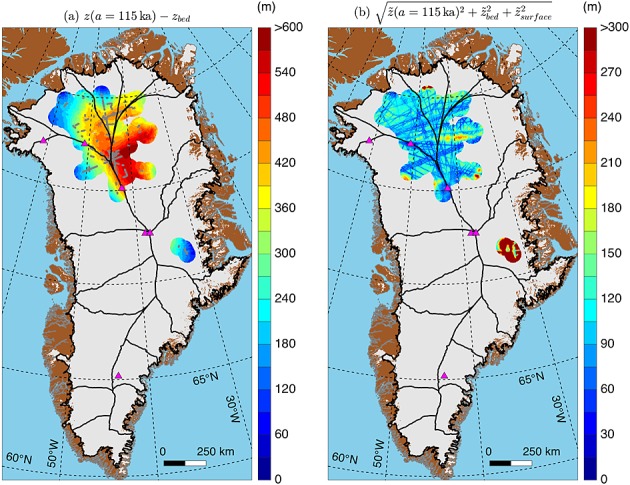
Figure 10.

(a) Apparent thickness of Eemian ice (≥115 ka) within the GrIS. Gray dots represent all mapped and dated internal reflections inferred to be 115 ka (the end of the Eemian period) or older. (b) Uncertainty in thickness of Eemian ice, expressed as the combination of the uncertainty in the depth of the 115 ka isochrone (Figure 9d) and the uncertainty in the gridded ice thickness [Bamber et al., 2013].
