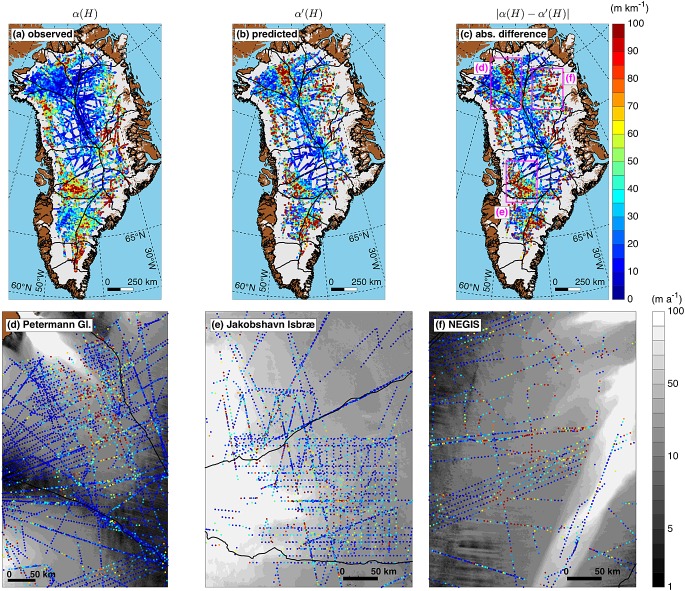
Figure 11.
(a) Observed along-track bed slope (α(H)) within 5 km intervals across the GrIS. (b) Along-track bed slope predicted by the depth profile of the slope of internal reflections (α′(H)) within the same 5 km intervals. (c) Absolute value of the residual between the observed and predicted bed slopes (|α(H) − α′(H)|). (d–f) |α(H) − α′(H)| within selected regions outlined by magenta dashed lines in Figure 11c. Background shading is the satellite-measured surface speed [Joughin et al., 2010]. For all panels, bed slopes and differences are plotted in ascending order to better resolve larger values.

