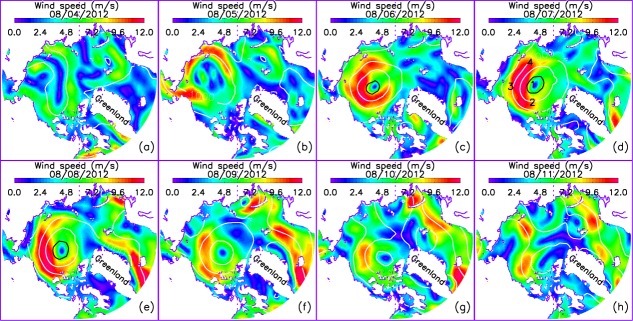
Figure 2.

NCEP/NCAR reanalysis surface wind speed during 4–11 August 2012. The black and white lines are NCEP/NCAR reanalysis sea level pressure (SLP, in hPa) contours with contour interval of 10 hPa. The black contour is the 980 hPa SLP contour and the white contours are with SLP greater than 980 hPa. The numbers of four locations detailed for analysis (section) are shown in (d).
