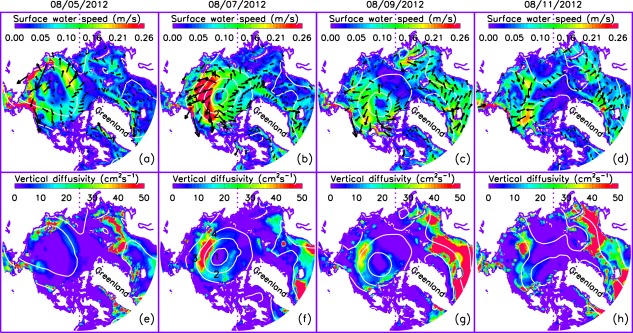
Figure 8.

Simulated surface ocean velocity (vector) and (a–d) speed (colors) and (e–h) mean vertical diffusivity in the upper 15 m of the Arctic Ocean over the period 5–11 August 2012. The white lines are NCEP/NCAR reanalysis sea level pressure (SLP) contours with contour interval of 10 hPa. One of every 100 surface ocean velocity vectors is plotted.
