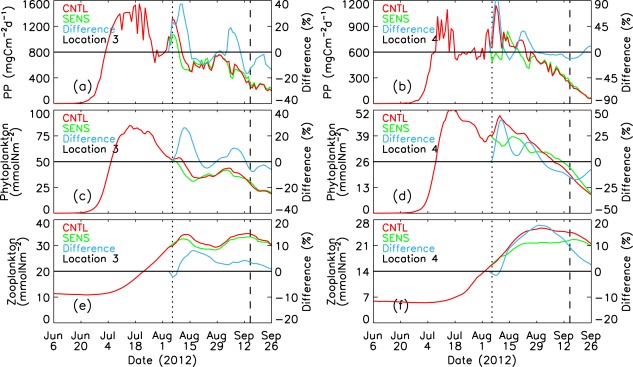
Figure 13.

CNTL-simulated and SENS-simulated daily PP, phytoplankton, and zooplankton in the upper 100 m of the water column at locations 3 and 4. The difference is calculated by (CNTL – SENS)/SENS*100%. The vertical dotted and dashed lines represent 6 August 2012 and 15 September 2012, respectively.
