
Figure 14.
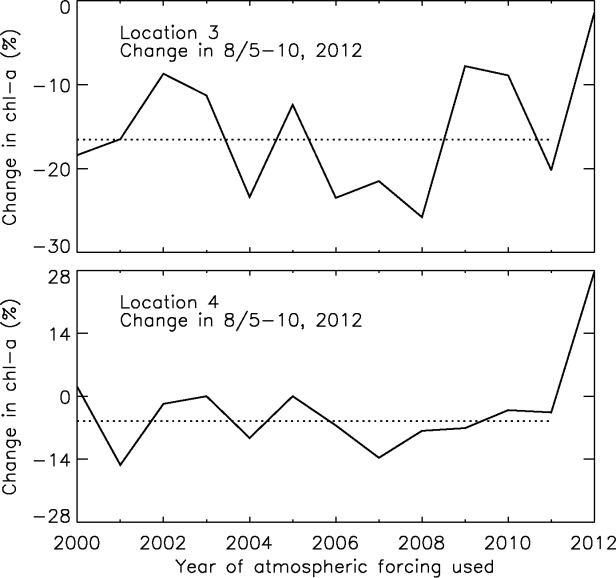
Change in chl a in the upper 100 m of the water column at locations 3 and 4 in 5–10 August2012 simulated by the 12 ENSE members forced by the reanalysis atmospheric forcing from the past 12 years (2000–2011) and by the CNTL run (2012). The dash line represents the average change of the 12 (2000–2011) ensemble simulations.